Anyone who orders stock sooner or later runs into the same question: how much to keep 'in reserve'? Too little — and you lose sales when a delivery is late or demand spikes. Too much — and you freeze cash and warehouse space. The formal answer to this question is called safety stock. It's worth understanding what it really is, because a lot of misconceptions have grown up around the term.
What safety stock is
Safety stock is a buffer that protects you against variability — in both demand and supply — during the window when you can no longer react with a new order. Nicolas Vandeput calls this window the risk horizon: the sum of the delivery lead time and the interval between successive orders. It's in that window that you're 'defenceless' — the decision has already been made, the goods haven't arrived yet, and sales keep rolling on.
A crucial distinction: safety stock is not there to cover normal, expected sales. That's what cycle stock is for (what usually sells through between deliveries). Safety stock exists solely to cover deviations from the forecast — the days when sales turned out higher than you assumed, or when a supplier was late. MIT's materials put it plainly: the buffer is about uncertainty, not the average.
How to calculate it
The textbook formula looks like this:
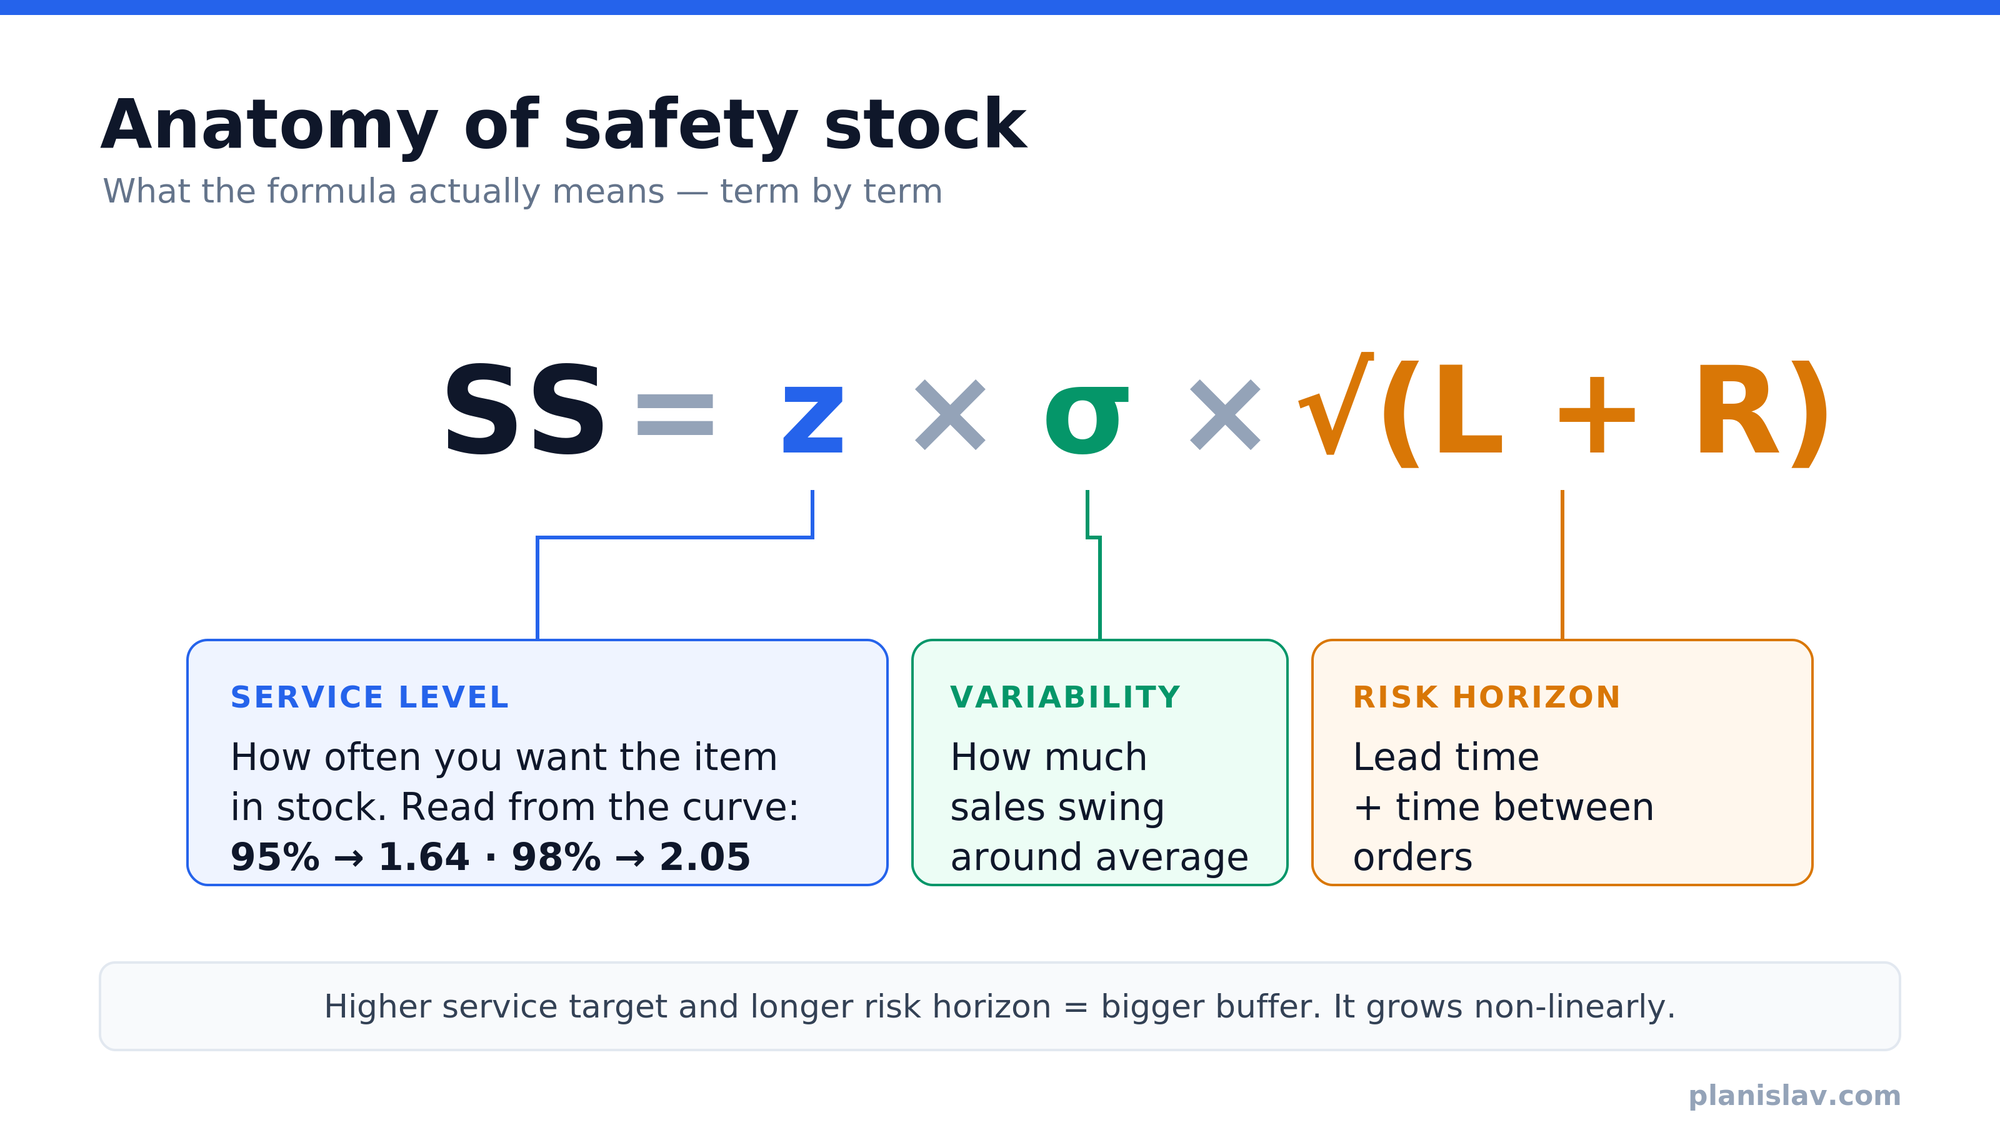
Safety stock = z × σ × √(L + R)
Let's break it into parts:
- z — the safety factor derived from your target service level. It's the number of standard deviations read off the normal distribution. Want to avoid a stockout in 95% of cycles? z ≈ 1.64. For 98% — z ≈ 2.05, for 90% — z ≈ 1.28. The higher your availability ambition, the bigger the buffer.
- σ — the standard deviation of demand per unit of time (e.g. per day). It tells you how much sales 'jump' around the average.
- L + R — the risk horizon: lead time plus the interval between orders. The square root comes from the fact that, across independent periods, variance adds up while the standard deviation grows with the square root of time — which is why the buffer grows with the risk horizon, but non-linearly.
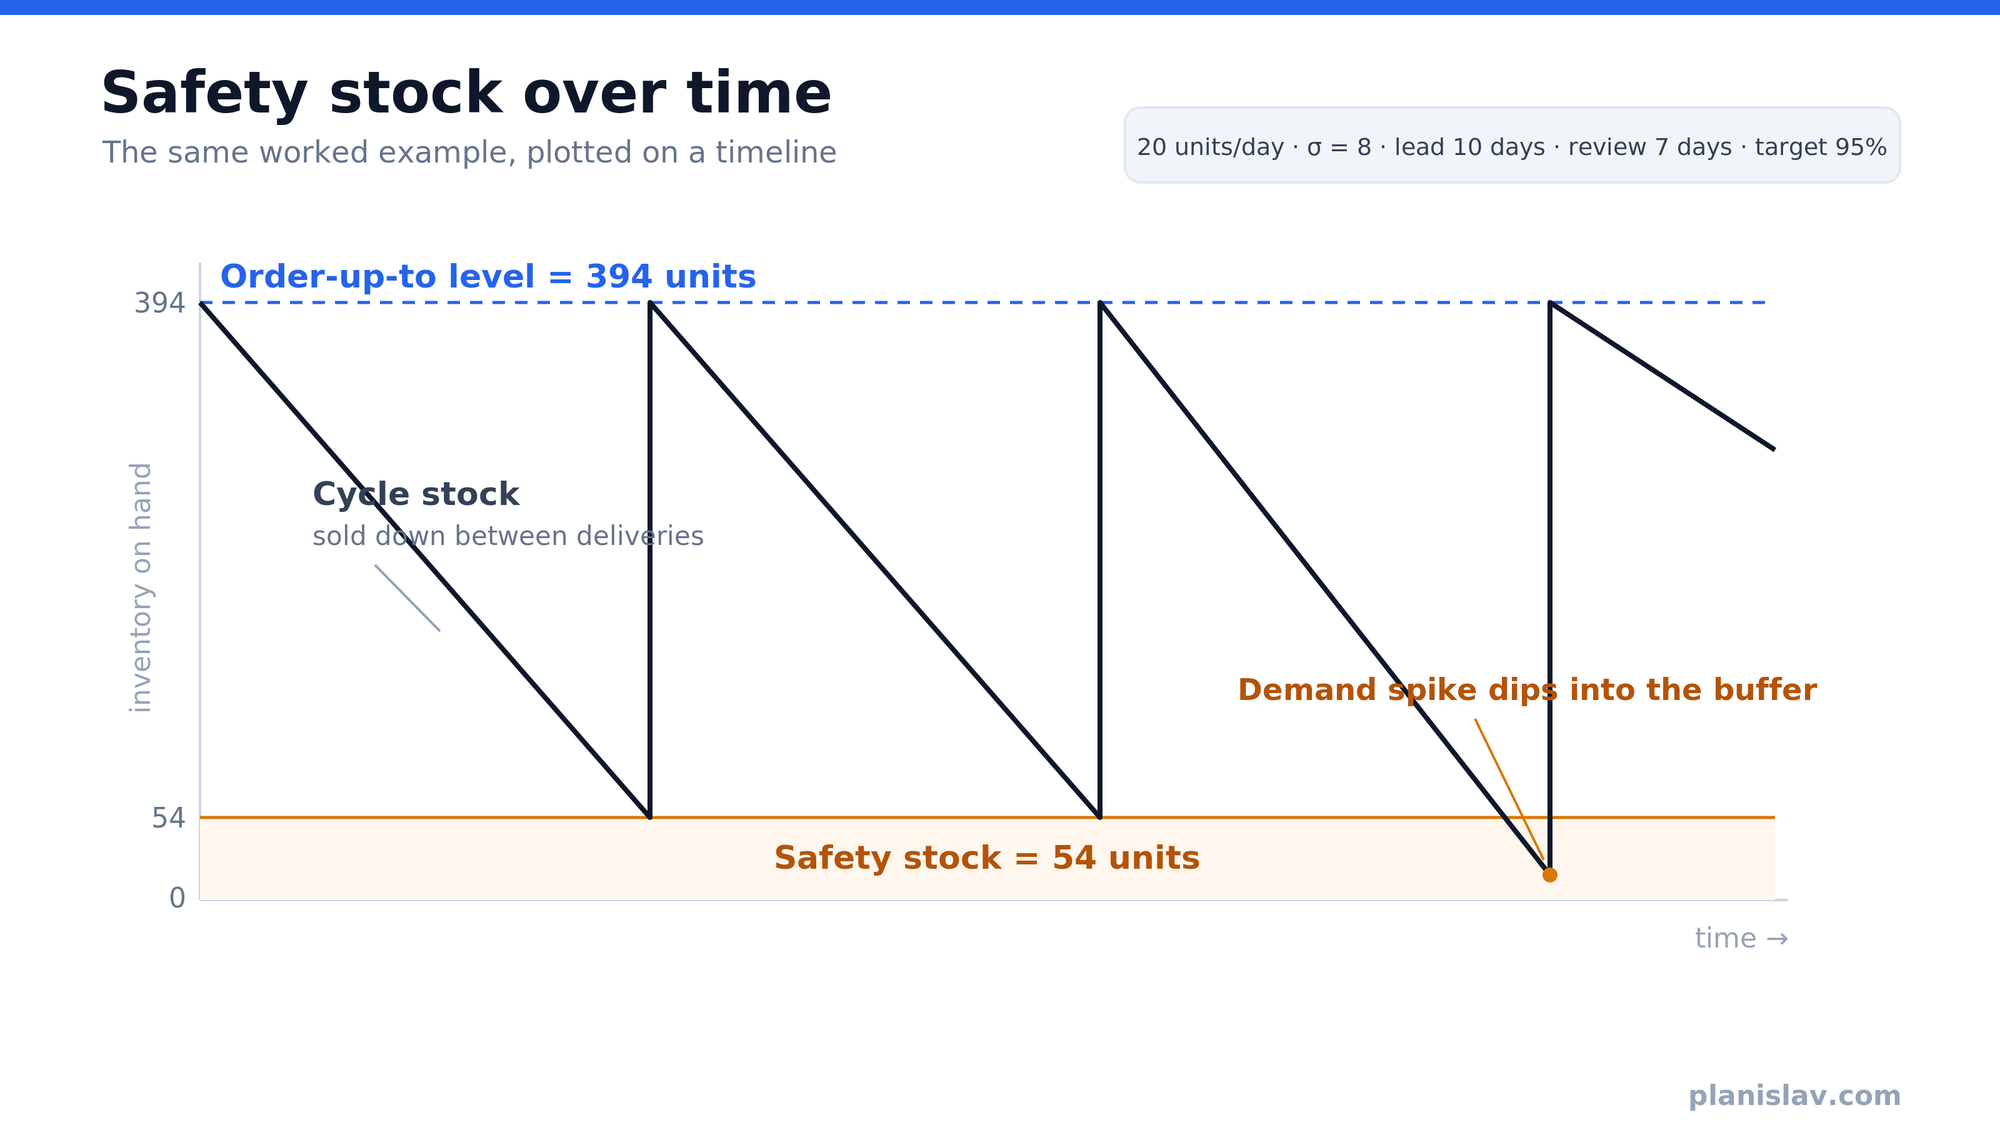
A simple example. You sell 20 units/day on average, with a standard deviation of 8 units/day. Delivery takes 10 days, you order every 7 days, and you're aiming for 95% availability (z = 1.64).
- Deviation over the risk horizon: 8 × √(10 + 7) = 8 × 4.12 ≈ 33 units.
- Safety stock: 1.64 × 33 ≈ 54 units.
- Order-up-to level (how high to top up): expected demand over the risk horizon + buffer = 20 × 17 + 54 = 394 units.
So at the next review you top the stock back up to ~394 units. Of that, 340 units is 'normal' sales within the risk window, and 54 units is the cushion in case something goes wrong. (If you reorder 'as you go', when stock drops to a reorder point — rather than at fixed intervals — only the lead time L counts toward the buffer, instead of L+R.)
Why it matters
Without a deliberate buffer you do one of two things: either you order 'by eye' and regularly hit stockouts, or you play it overly safe and sink cash into excess. Safety stock turns this into a conscious decision: you choose the service level, and the maths tells you what it costs in units on the shelf. What's more, it lets you differentiate — a bestseller with steady sales needs a proportionally smaller buffer than a product that sometimes sells brilliantly and sometimes not at all. That's the whole value of this approach: it fits the cushion to the item's actual risk.
So why do most companies still keep 'days of cover'
If the formula is so elegant, why does a simpler measure dominate in practice — days of cover?
Days of cover = stock on hand ÷ average daily sales
Instead of computing σ and picking z, you simply say: 'keep 30 days of stock'. There are several reasons for its popularity and — importantly — most of them are rational:
- It needs one input. Days of cover only requires average sales. The safety-stock formula needs the standard deviation of demand over the risk horizon, a chosen service level and reliable lead-time data. MIT itself admits that most companies don't track forecast error as precisely as the formula demands — they simply don't have the clean data it would rest on.
- Everyone understands it. 'We have 20 days of stock' is understood by the warehouse worker, the owner and the accountant. 'The buffer is 1.64 sigma' — not so much. A measure in days communicates itself.
- It scales itself. A target expressed in days automatically rises and falls with sales — when demand grows, a '30-day' target translates into more units with no manual adjustment. Vandeput points to this as a genuine advantage of targets expressed as period coverage.
- The formula can be brittle. The classic version assumes demand (or rather forecast error) is normally distributed. In real e-commerce, demand is usually right-skewed — lots of small values and a few big spikes. Some software vendors and practitioners go further and argue that in such cases the formula's output can be detached enough from reality that planners override it by hand in Excel anyway. Days of cover sidesteps the whole distribution problem.
The catch worth knowing about
Simplicity has its price. Days of cover ignores variability — the very thing safety stock was invented for. Two items with the same average sales get the same buffer, even if one sells like clockwork and the other swings by 300%. The effect is paradoxical: with a single blanket number of days you are simultaneously overstocked on the stable products and understocked on the volatile ones. The same cash tied up in the warehouse, worse availability exactly where you need it. A flat 'days of cover' also doesn't distinguish supply-side risk, nor does it let you say 'I want 98% availability on the top items, 90% on the tail'.
The takeaway
Days of cover isn't a 'mistake' — it's a sensible response to data limitations and the need for simplicity. Even practitioners like Vandeput defend targets expressed in days, as long as there's a model behind them that refreshes them regularly. The real step forward, then, isn't abandoning coverage for one magic formula. It's making the buffer — whether you call it safety stock or days of cover — account for variability: differentiating it by how unpredictable a given item is and how much you care about its availability. One number for the whole assortment is easy. It's rarely cheap.
What this is based on: MIT's SCM program materials (MicroMasters in Supply Chain Management) and Nicolas Vandeput's publications on inventory optimization.
Why we're writing about this
At Planislav we approach this problem head-on: instead of handing you yet more dials — a choice of service level, reorder point, mode — we analyse your sales history and set the buffer for each product's variability ourselves. What comes out isn't a model to configure, but a shopping list: buy X units by day Y from supplier Z. Want to know why exactly that much? You ask, and you get the answer in a single sentence.
That's the difference between 'keep 30 days on everything' and a cushion that knows one product sells like clockwork while another swings by 300%.
Stop guessing how much to order. — planislav.com