Knowledge
Knowledge hub. Articles on purchase planning, demand forecasting, and inventory management.
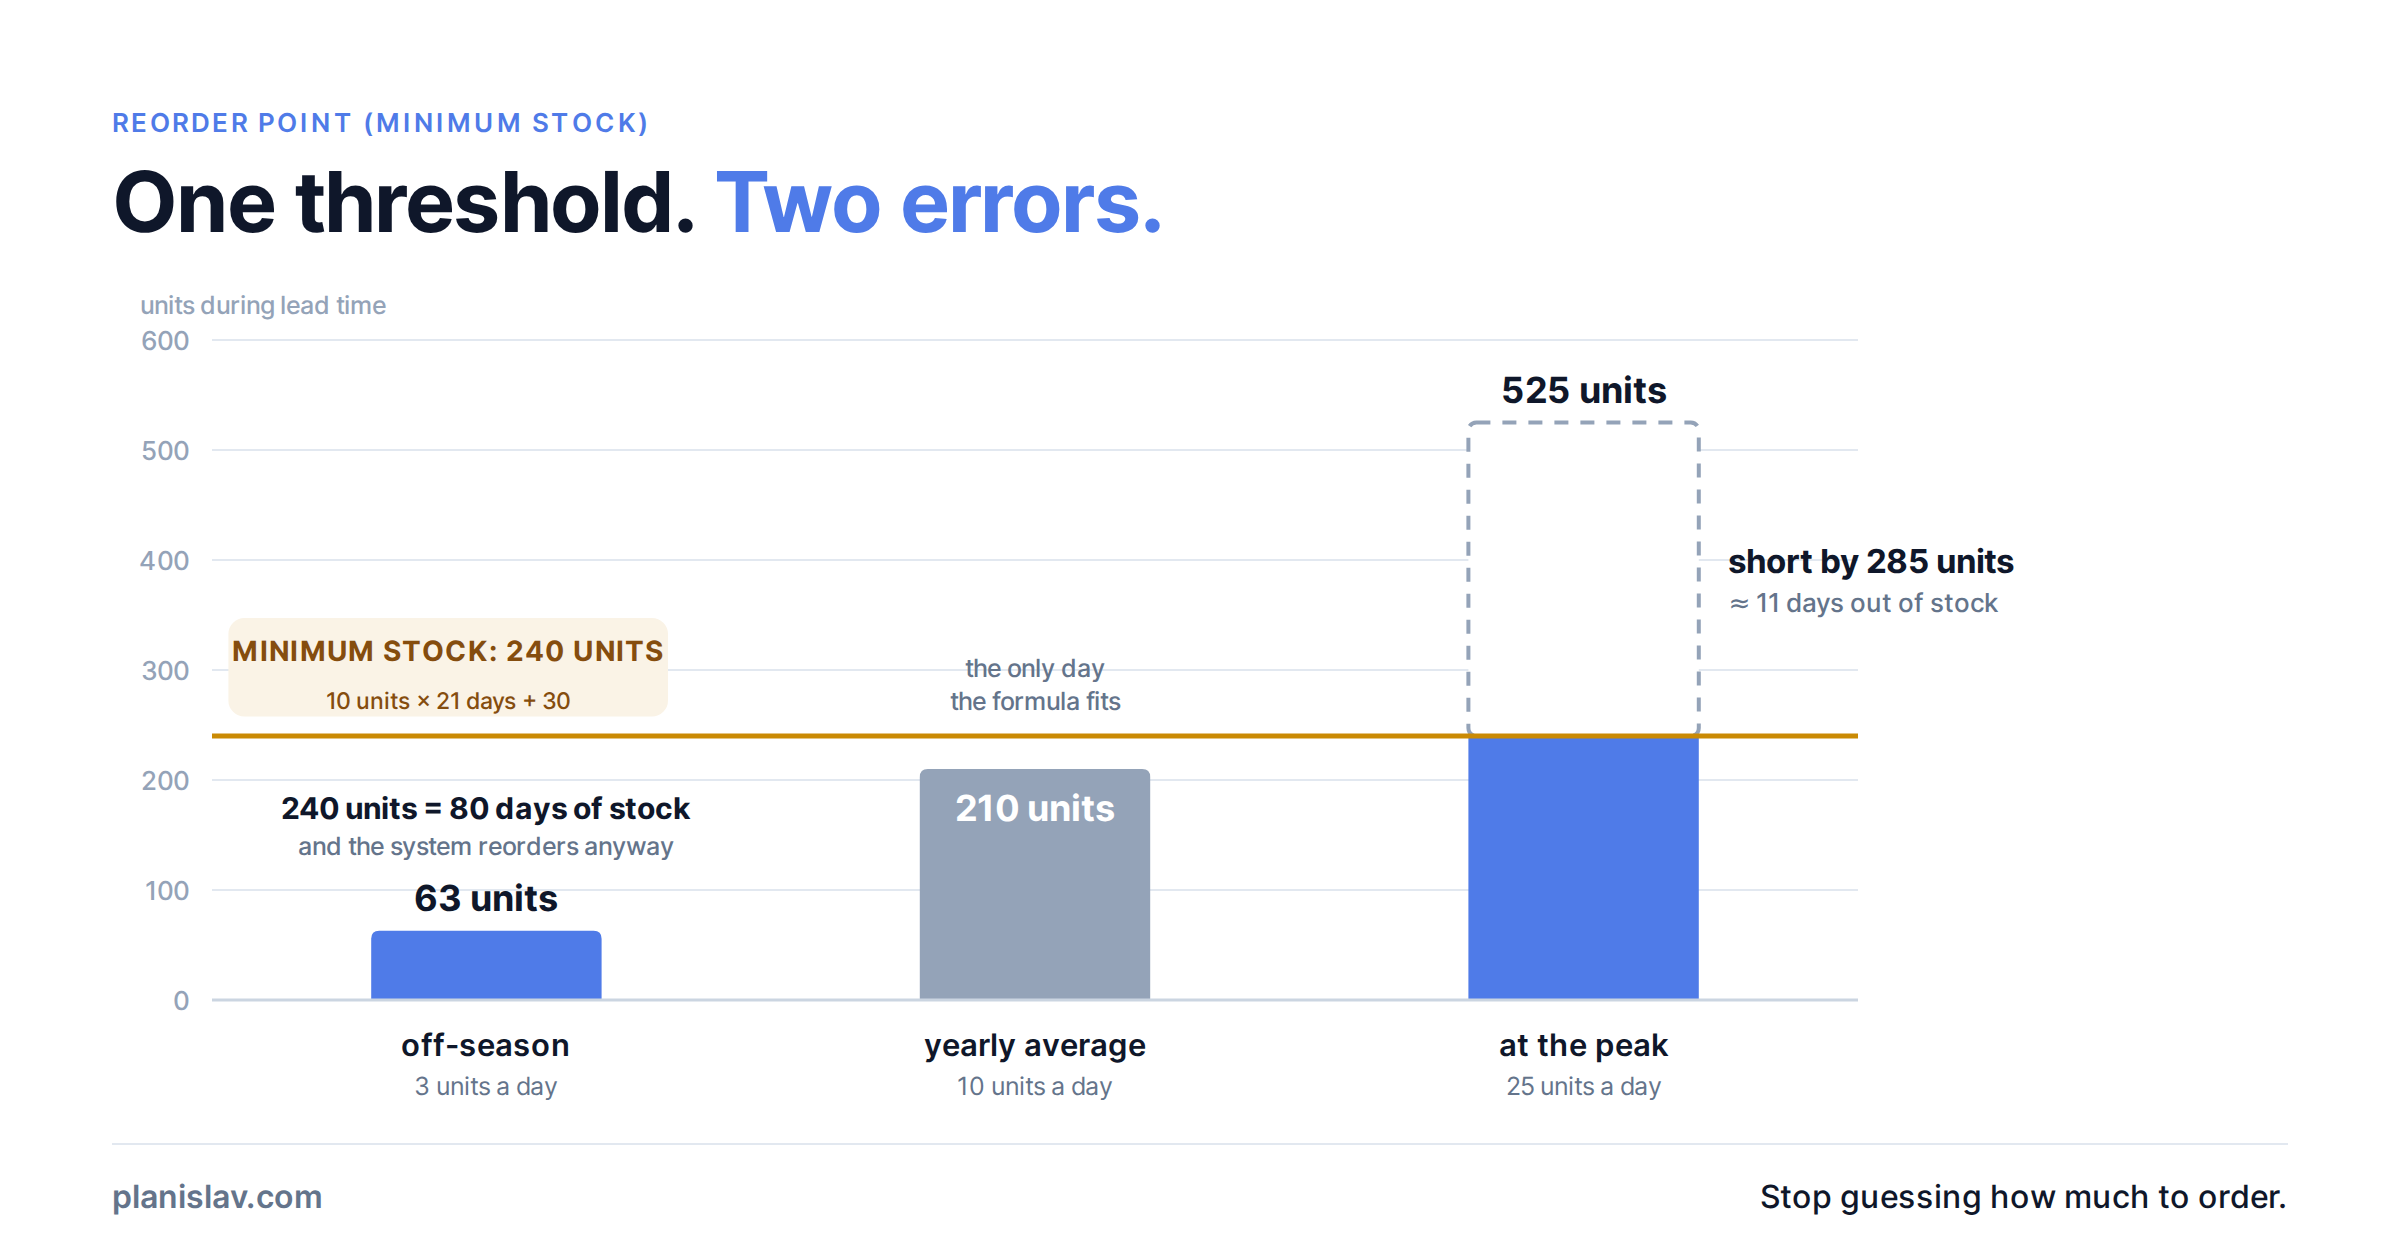
One reorder point for every product: why it works at 50 SKUs and quietly breaks at 2,000
How did you set your minimum stock: from the formula or by gut? We checked what Base.com and the mainstream Polish ERPs actually calculate, why one threshold for all SKUs fails, and what it costs.
Read more →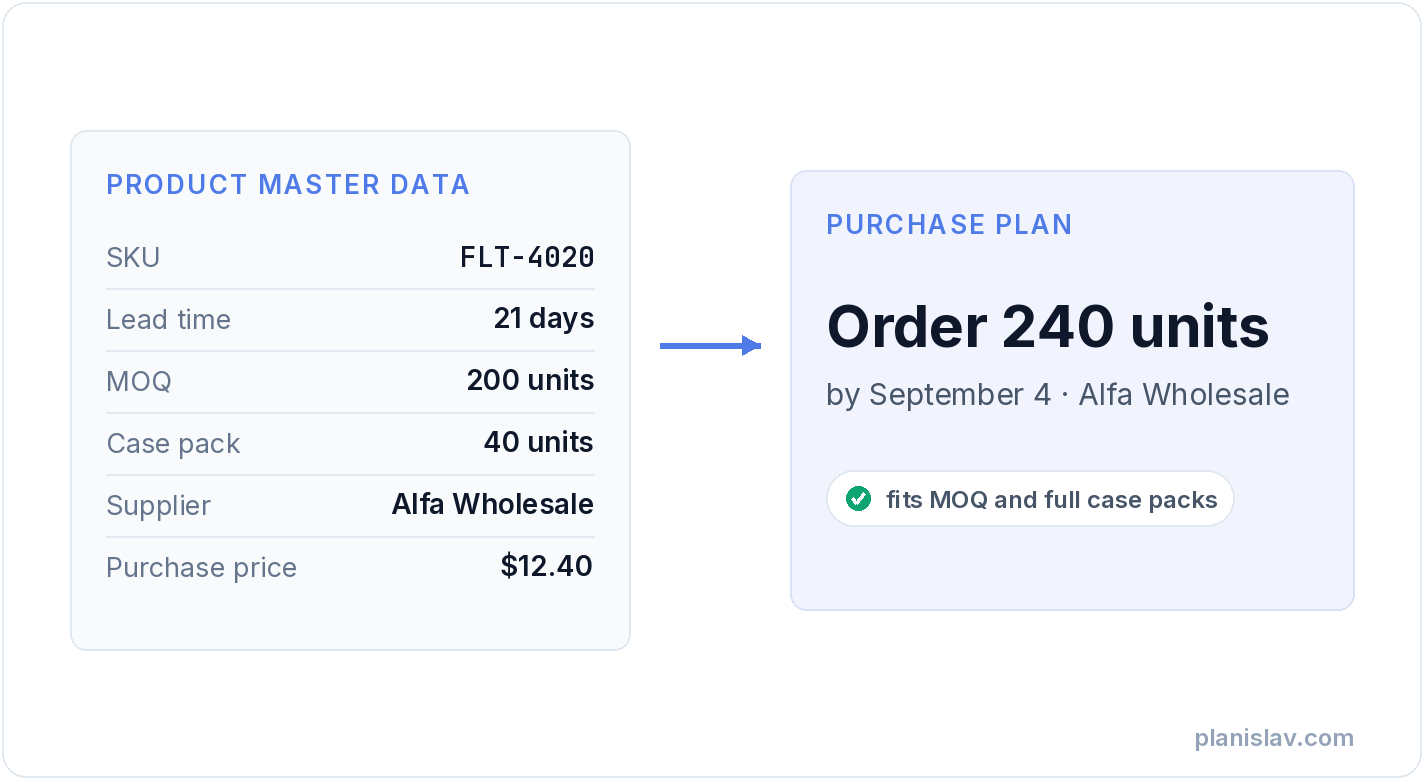
Master data: what it is and why every purchase plan is guessing without it
A forecast tells you how much you'll sell. But between the forecast and the order stand a few boring numbers: lead time, MOQ, case pack, purchase price. That's master data — the least glamorous part of purchase planning, and the part that decides whether the plan can be executed.
Read more →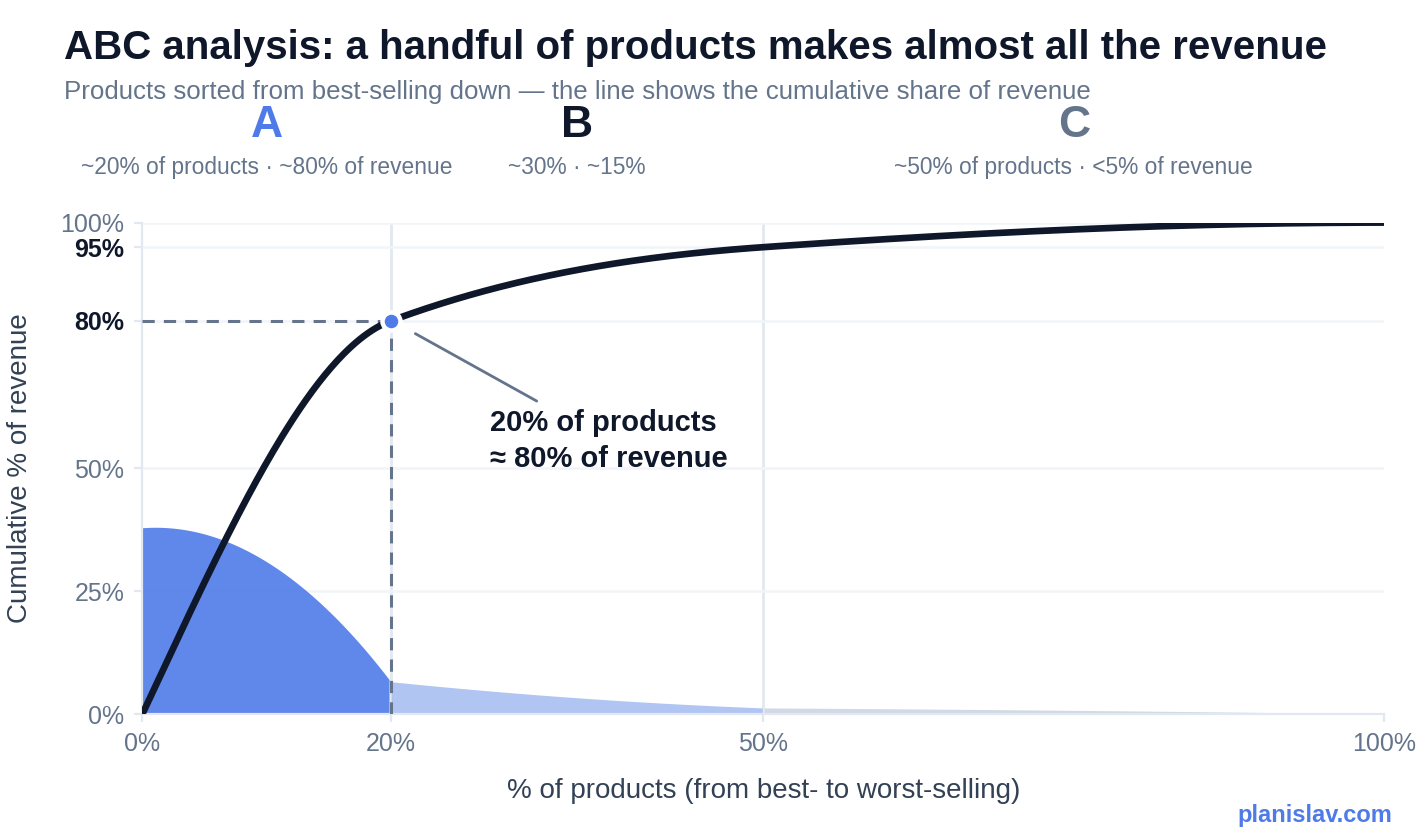
ABC Analysis in E-commerce: Which Products Actually Keep Your Store Alive?
What is ABC analysis and how do you split your products into A, B and C classes? The 80/20 method step by step, an Excel example with a free template, pitfalls and FAQ.
Read more →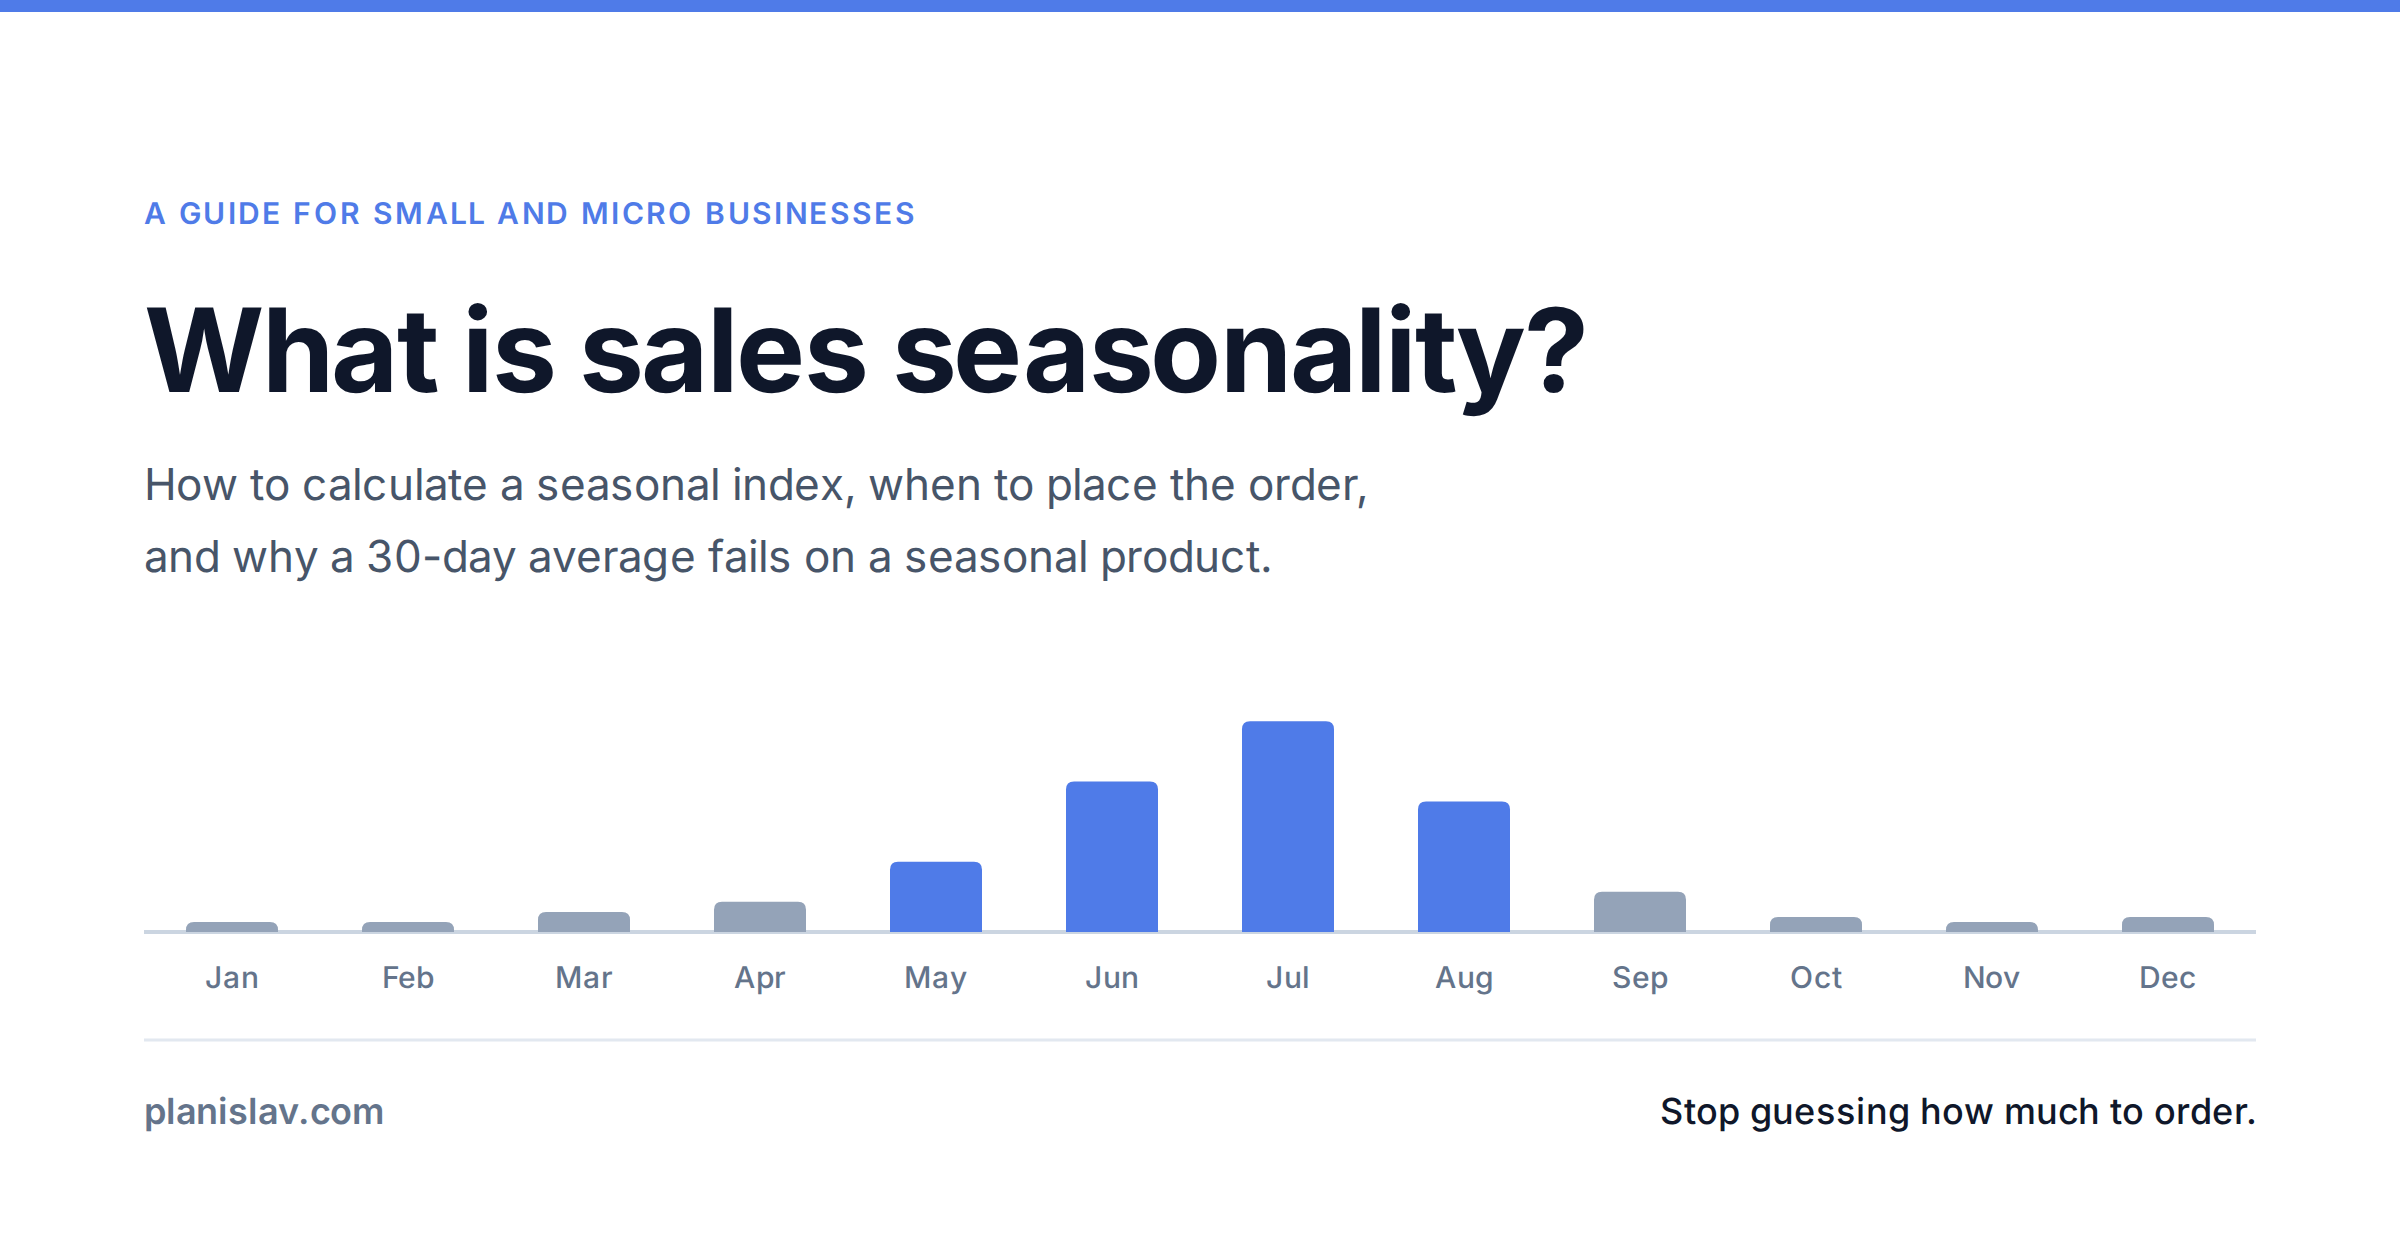
Sales seasonality: what it is and how it wrecks your stock levels
Seasonality is a repeating demand pattern that comes back at the same time every year. How to calculate a seasonal index in a spreadsheet, why a July peak means a May order, and the five pitfalls that break those numbers.
Read more →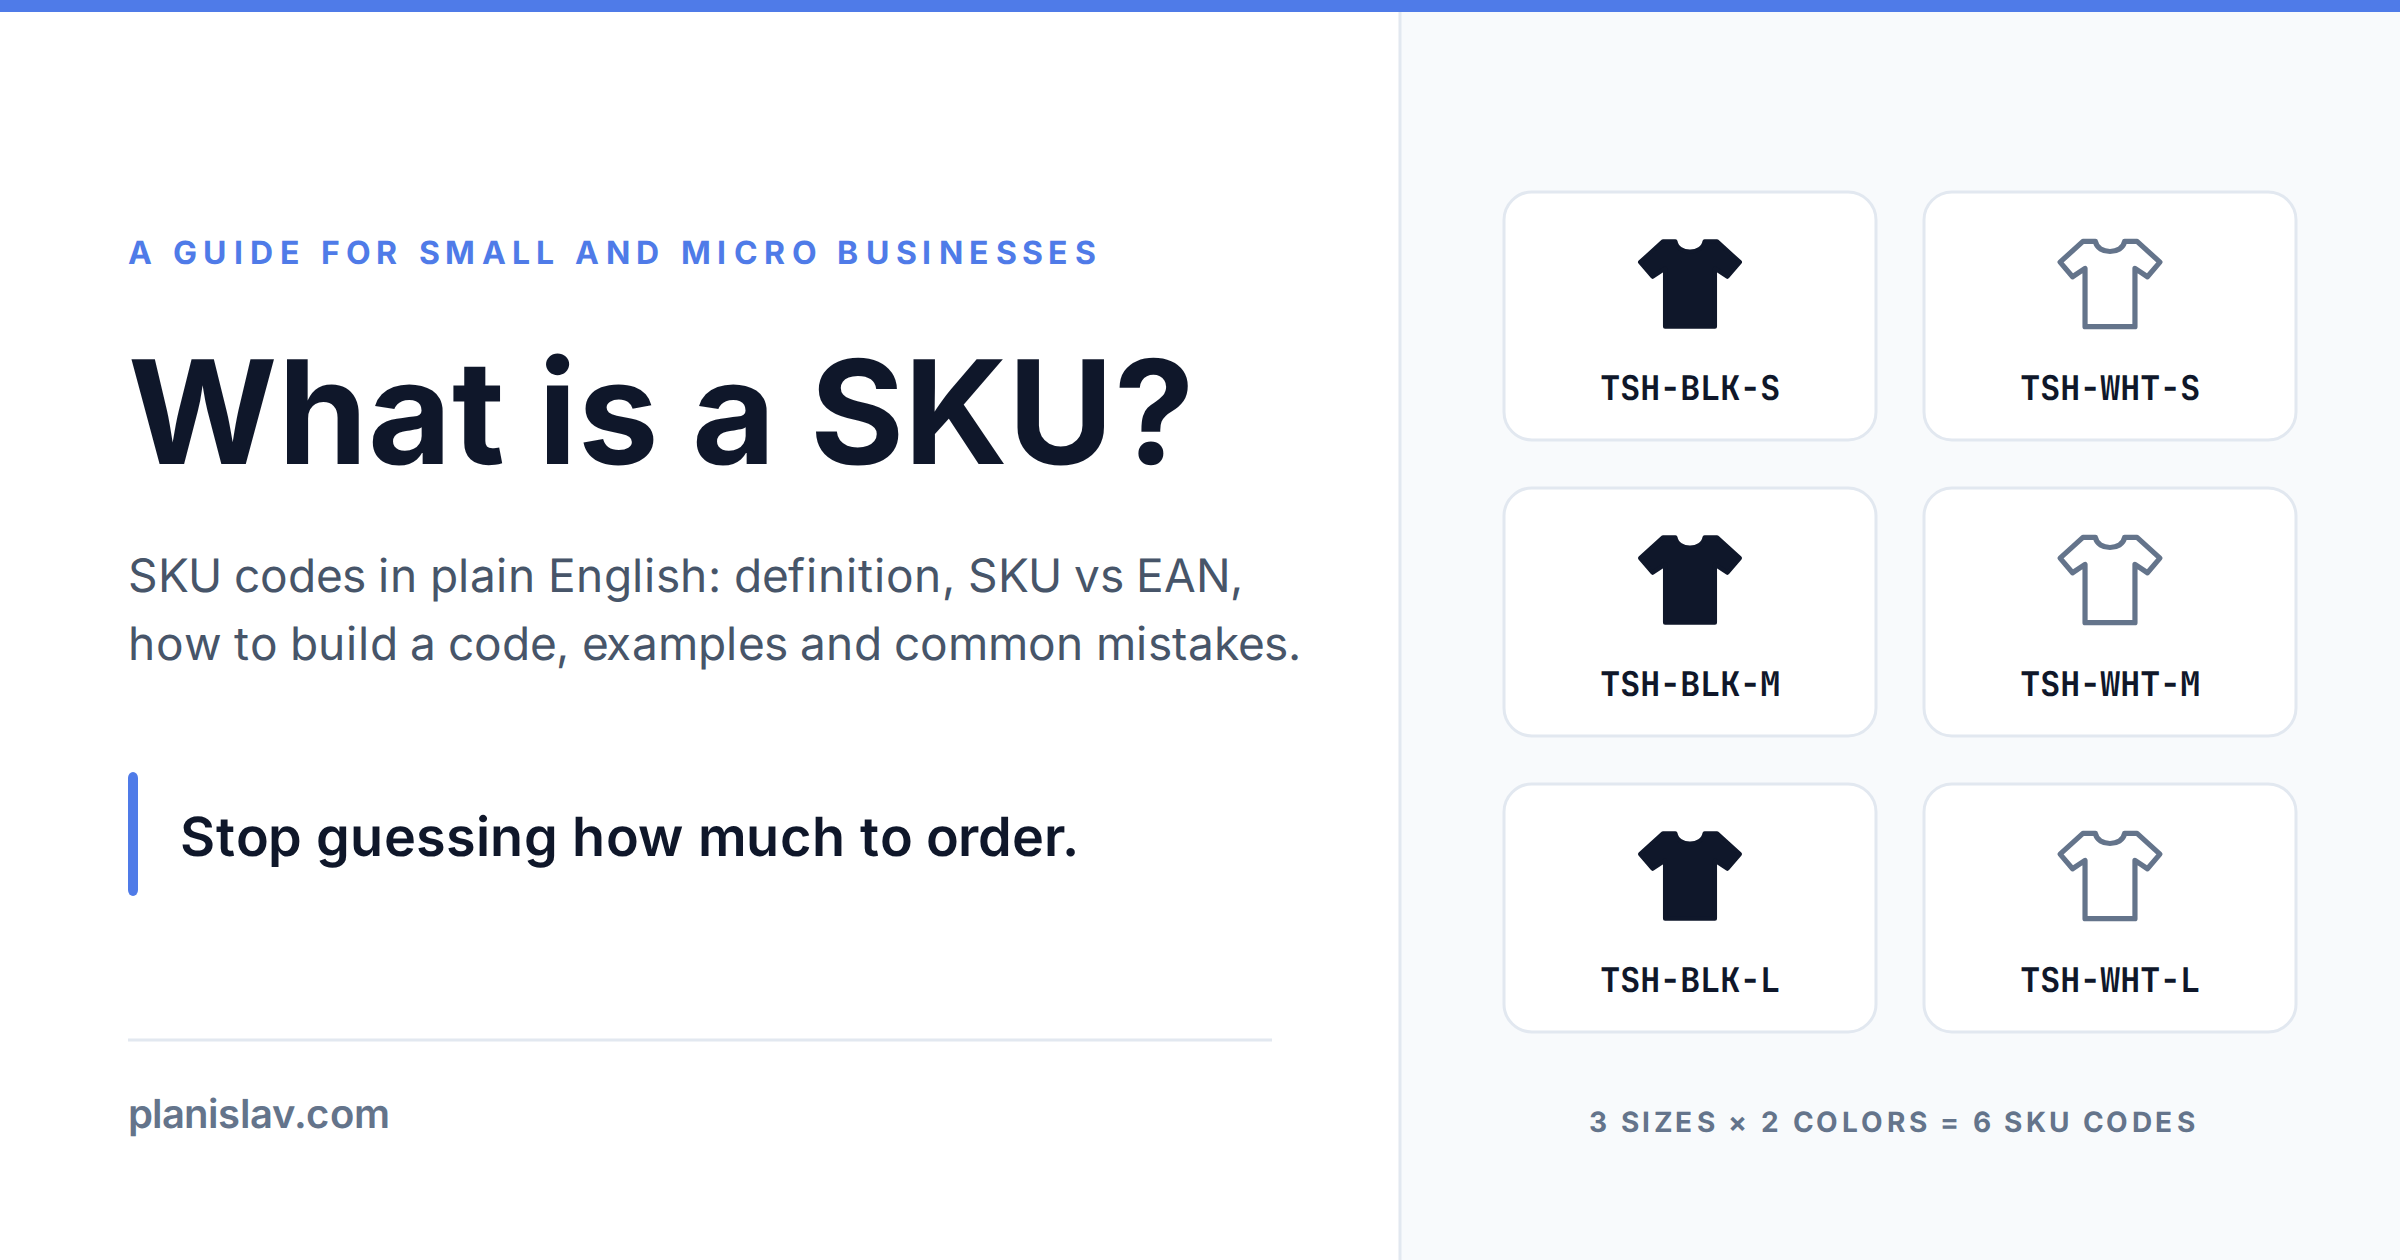
What is a SKU? SKU code and SKU number guide for small businesses
A SKU is a unique code you assign yourself to every product variant. How it differs from an EAN, how to build a good code, real examples and the most common mistakes — in plain English, for micro and small businesses.
Read more →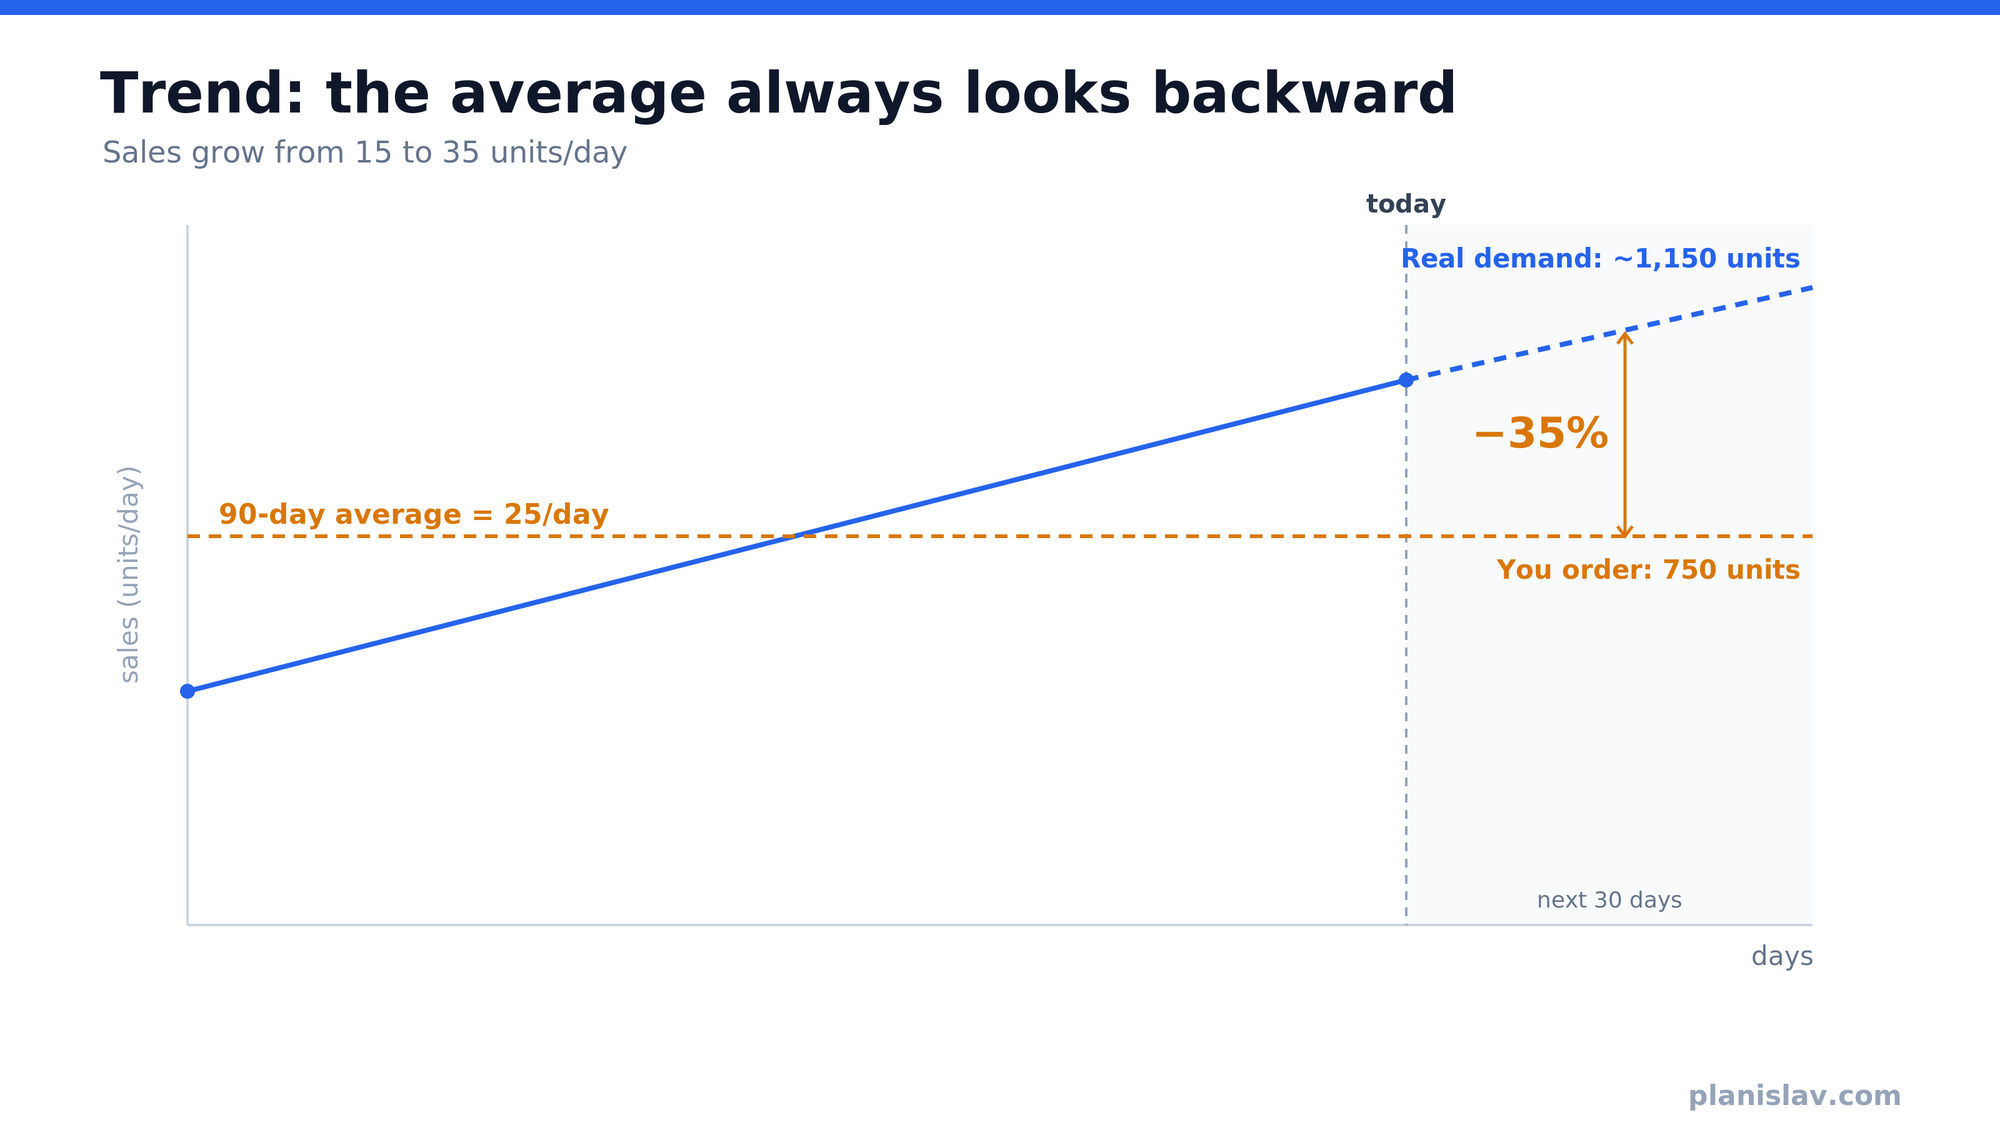
A 30-day average is not a forecast. Why rolling averages quietly wreck your inventory
The most common way to plan purchasing — a 30/60/90-day average times days to delivery — isn't wrong occasionally, it's wrong systematically: it lags the trend, can't see the season and misleads on intermittent demand. We show each case with numbers.
Read more →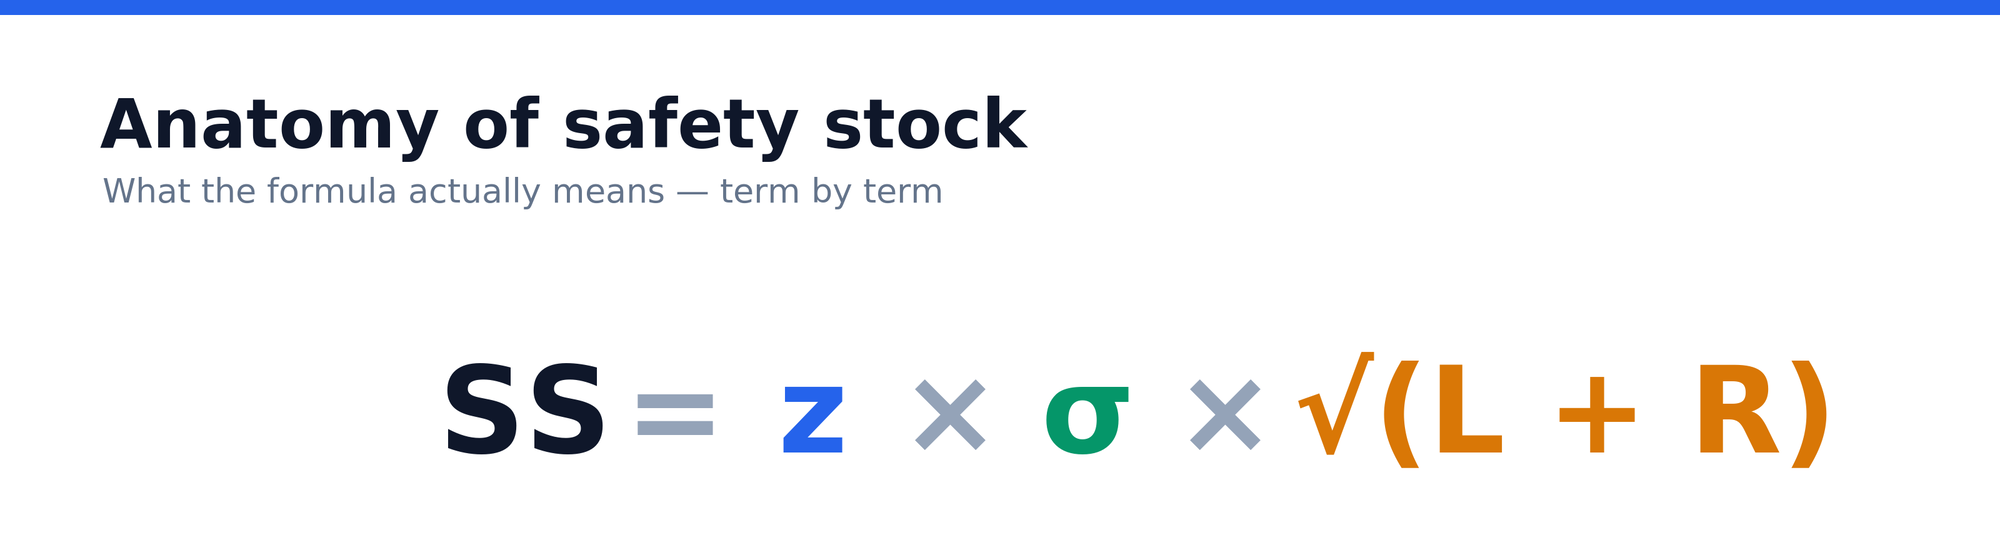
Safety stock: what it is, how to calculate it, and why most companies stick with 'days of cover' anyway
Safety stock is a buffer against demand and supply variability — and there's an elegant formula to compute it. So why do most companies stick with 'days of cover' anyway? Because simplicity makes sense — until it starts to cost.
Read more →
What did your last stockout cost you?
A stockout has at least three hidden costs — lost margin, a lost customer and a marketplace ranking penalty. And if you don't know what your last one cost you, that doesn't mean it cost zero.
Read more →
We were at Base Expo 2026. One topic came back in every panel — and it wasn't technology
We went to listen to what Polish e-commerce is living with. The thread that came back most often wasn't technology or marketing — it was stockouts, and processes nobody had put in order.
Read more →