Sales seasonality is a repeating, predictable pattern of demand that comes back at the same time every year. Fans sell in July, Christmas trees in December, backpacks in August. That is not luck and it is not “a good month” — it is a rhythm you can measure and buy against. If you run a small online store, seasonality is probably the single biggest reason you run out of one product while another sits in a box for eleven months.
In a nutshell: a repeating demand pattern on a yearly (or weekly, or monthly) cycle. You measure it with a seasonal index — one month's sales divided by the average month. An index of 3.55 means “this month I sell 3.5× my average”. And the order has to be placed one full lead time before the peak, not during it.
You know the feeling. It is July, it is hot, customers are asking about the fan, and you are typing “sorry, out of stock right now”. Or the reverse: it is September and there are a hundred units in the stockroom that you panic-bought in July, and you already know they will not move until next summer — if they move at all. Both come from the same root cause: the order was based on what happened recently, not on what is about to happen.
This guide explains seasonality without the jargon — what it is, how to calculate it in a spreadsheet, how it turns into an actual number of units on a purchase order, and where people usually get it wrong.
What is sales seasonality? A definition
Seasonality is a regular, repeating deviation of sales from their average level. The key word is repeating. A one-off spike because a video took off is not seasonality. A spike that comes back in the same month for the third year running is.
And it is not only summer and Christmas. In a small store, three cycles usually run at once:
- The yearly cycle — months and quarters. Fans, winter coats, gifts, school supplies, garden.
- The weekly cycle — Monday and Sunday evening usually beat Saturday morning. This matters for picking and dispatch planning more than for supplier orders.
- The monthly cycle — payday weeks and the first ten days of the month are often visibly stronger.
For stock planning, the yearly cycle is the one that counts, because it decides how many units physically need to be in your warehouse two months from now.
Seasonality, trend and noise are three different things
The most common beginner mistake is throwing every wobble into one bucket. Your sales are actually the sum of three separate components, and each one calls for a different response:
- Trend — the long-run direction, growing or shrinking. For example +15% year over year as new channels come online. Response: scale the whole forecast up or down.
- Seasonality — a repeating pattern within the cycle. For example July is always 3× the average month. Response: shift orders in time and change their size.
- Noise — random variation with no pattern. For example one slow week because it rained. Response: none. Safety stock absorbs it.
Treat seasonality as noise and you will react too late. Treat noise as seasonality and you will buy against a coincidence. Telling them apart is, more or less, the whole craft of purchase planning.
How to calculate a seasonal index, step by step
The simplest useful measure is the seasonal index: sales in a given month divided by the average month across the year. A spreadsheet is all you need.
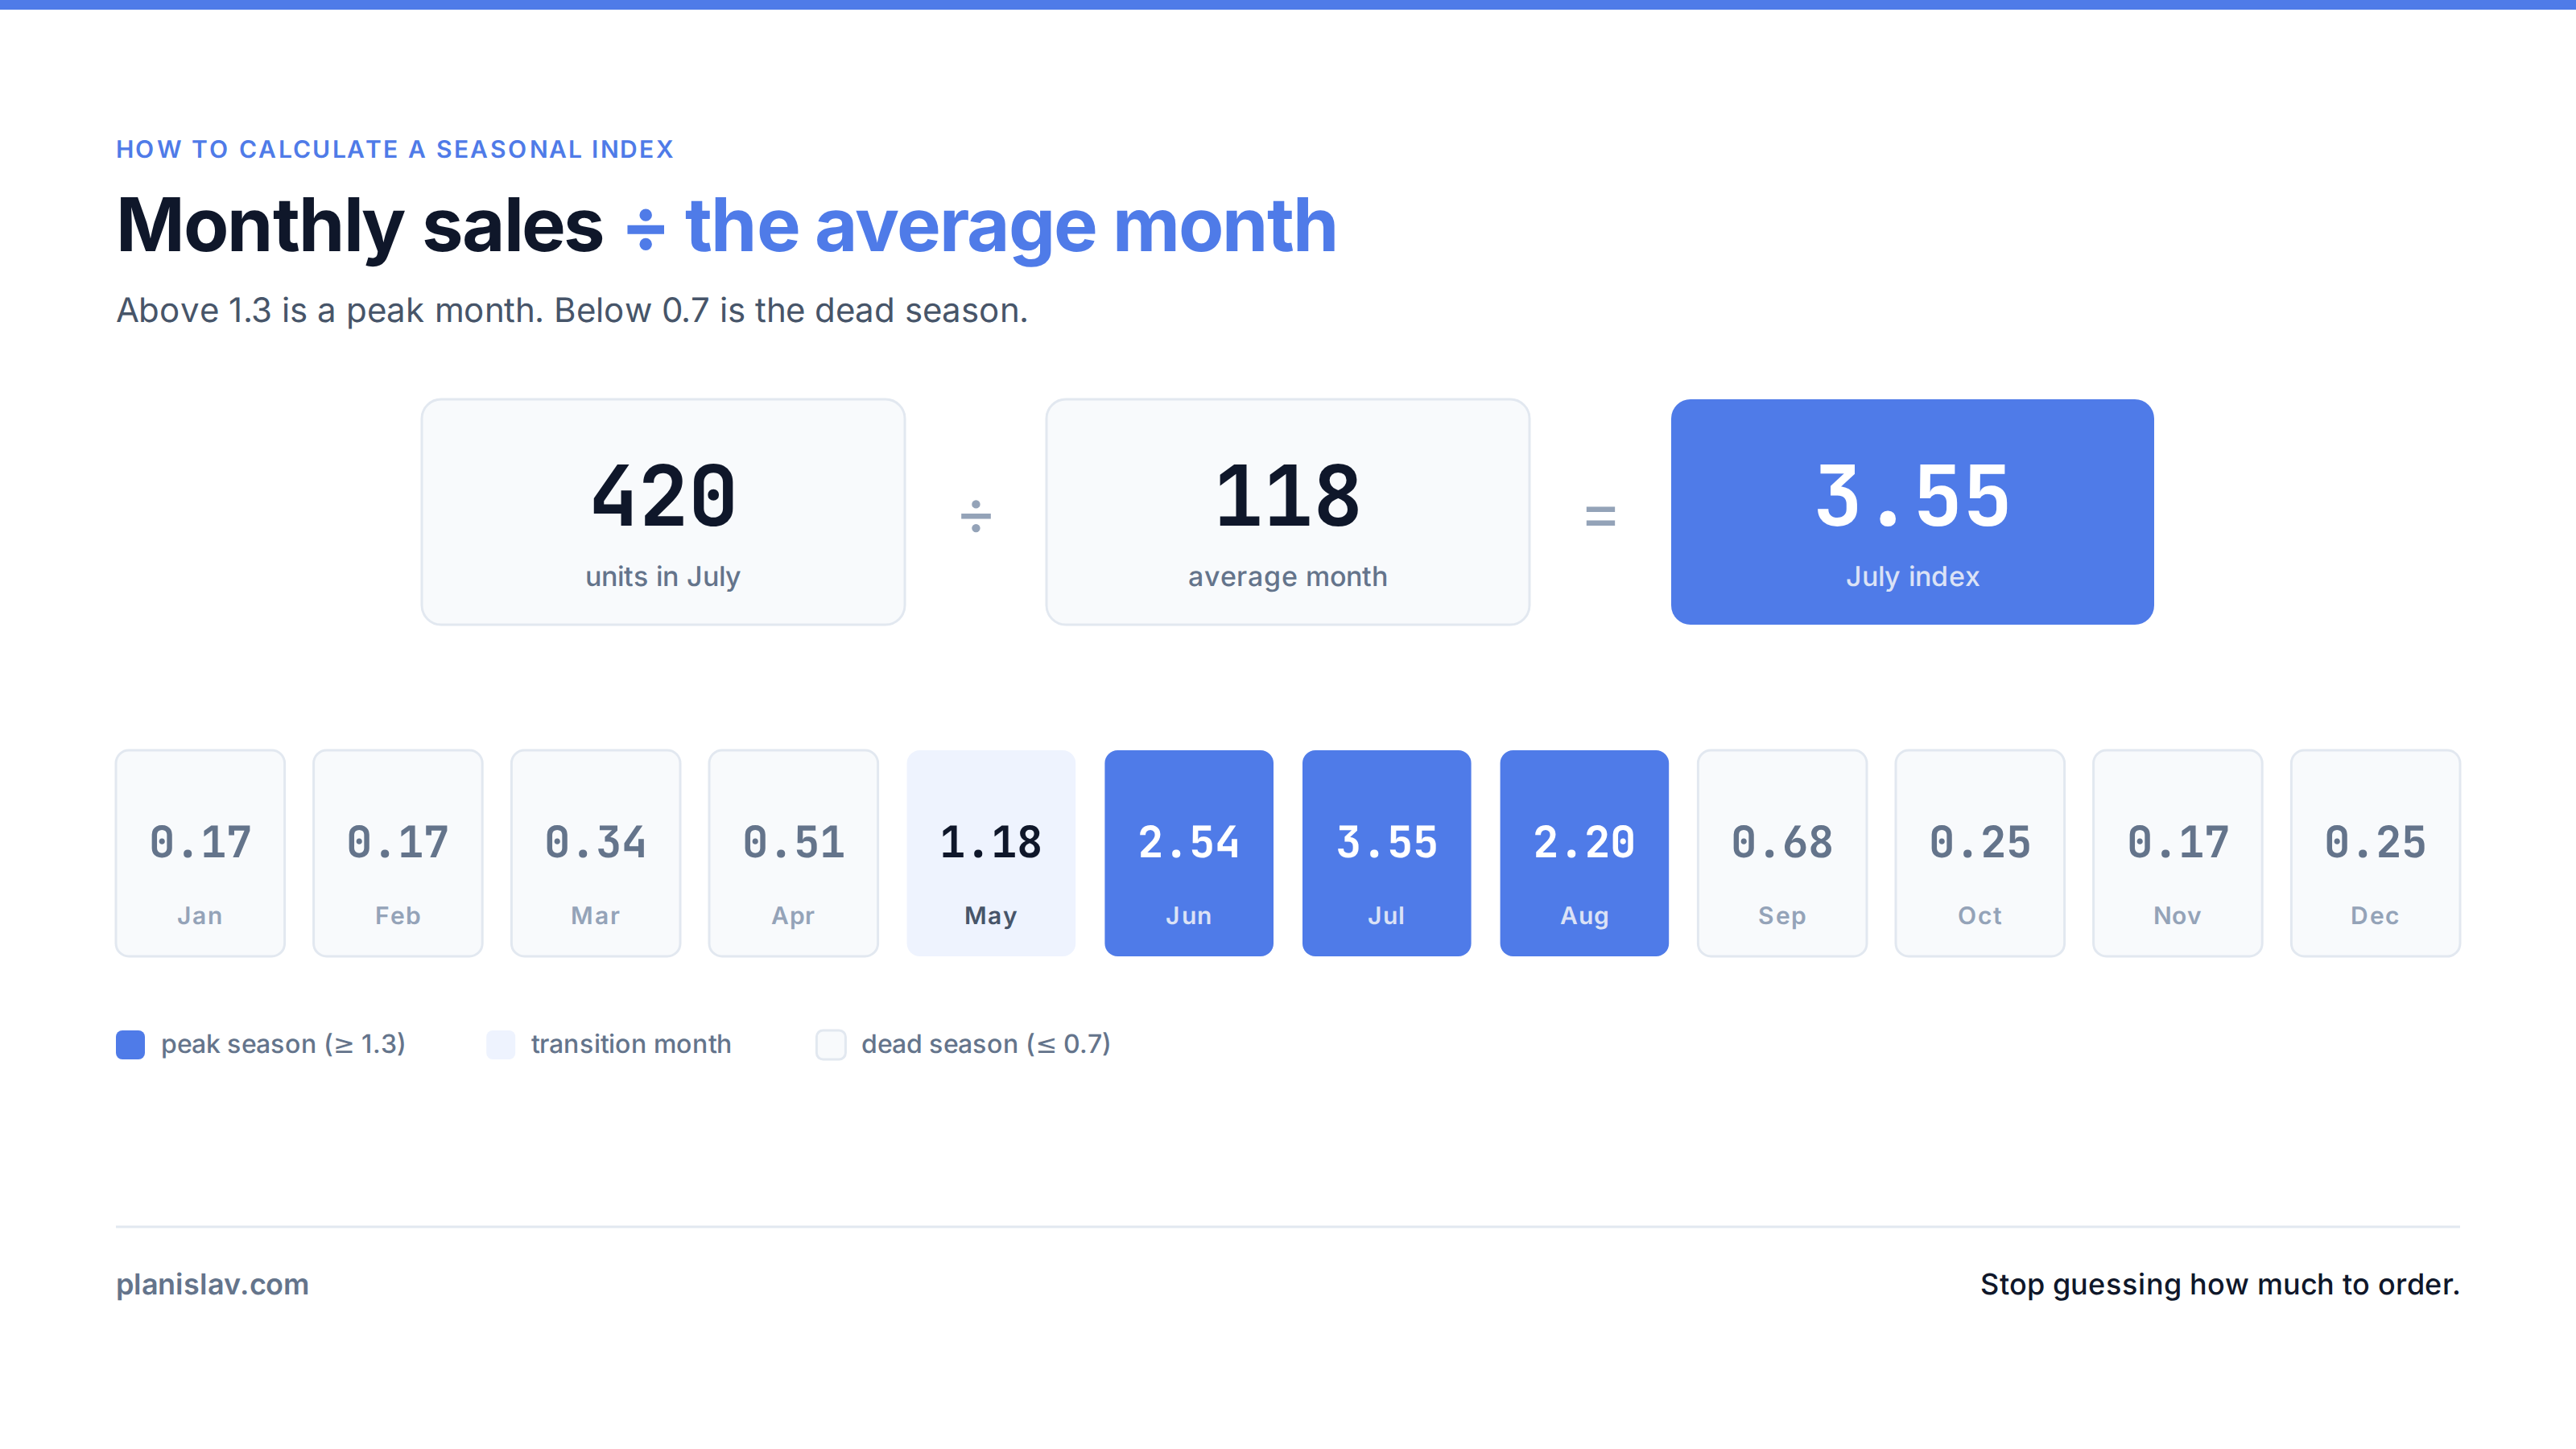
Take a realistic example — a desk fan, SKU FAN-WHT-30. Units sold last year, with the index for each month:
- January — 20 units, index 0.17
- February — 20 units, index 0.17
- March — 40 units, index 0.34
- April — 60 units, index 0.51
- May — 140 units, index 1.18
- June — 300 units, index 2.54
- July — 420 units, index 3.55
- August — 260 units, index 2.20
- September — 80 units, index 0.68
- October — 30 units, index 0.25
- November — 20 units, index 0.17
- December — 30 units, index 0.25
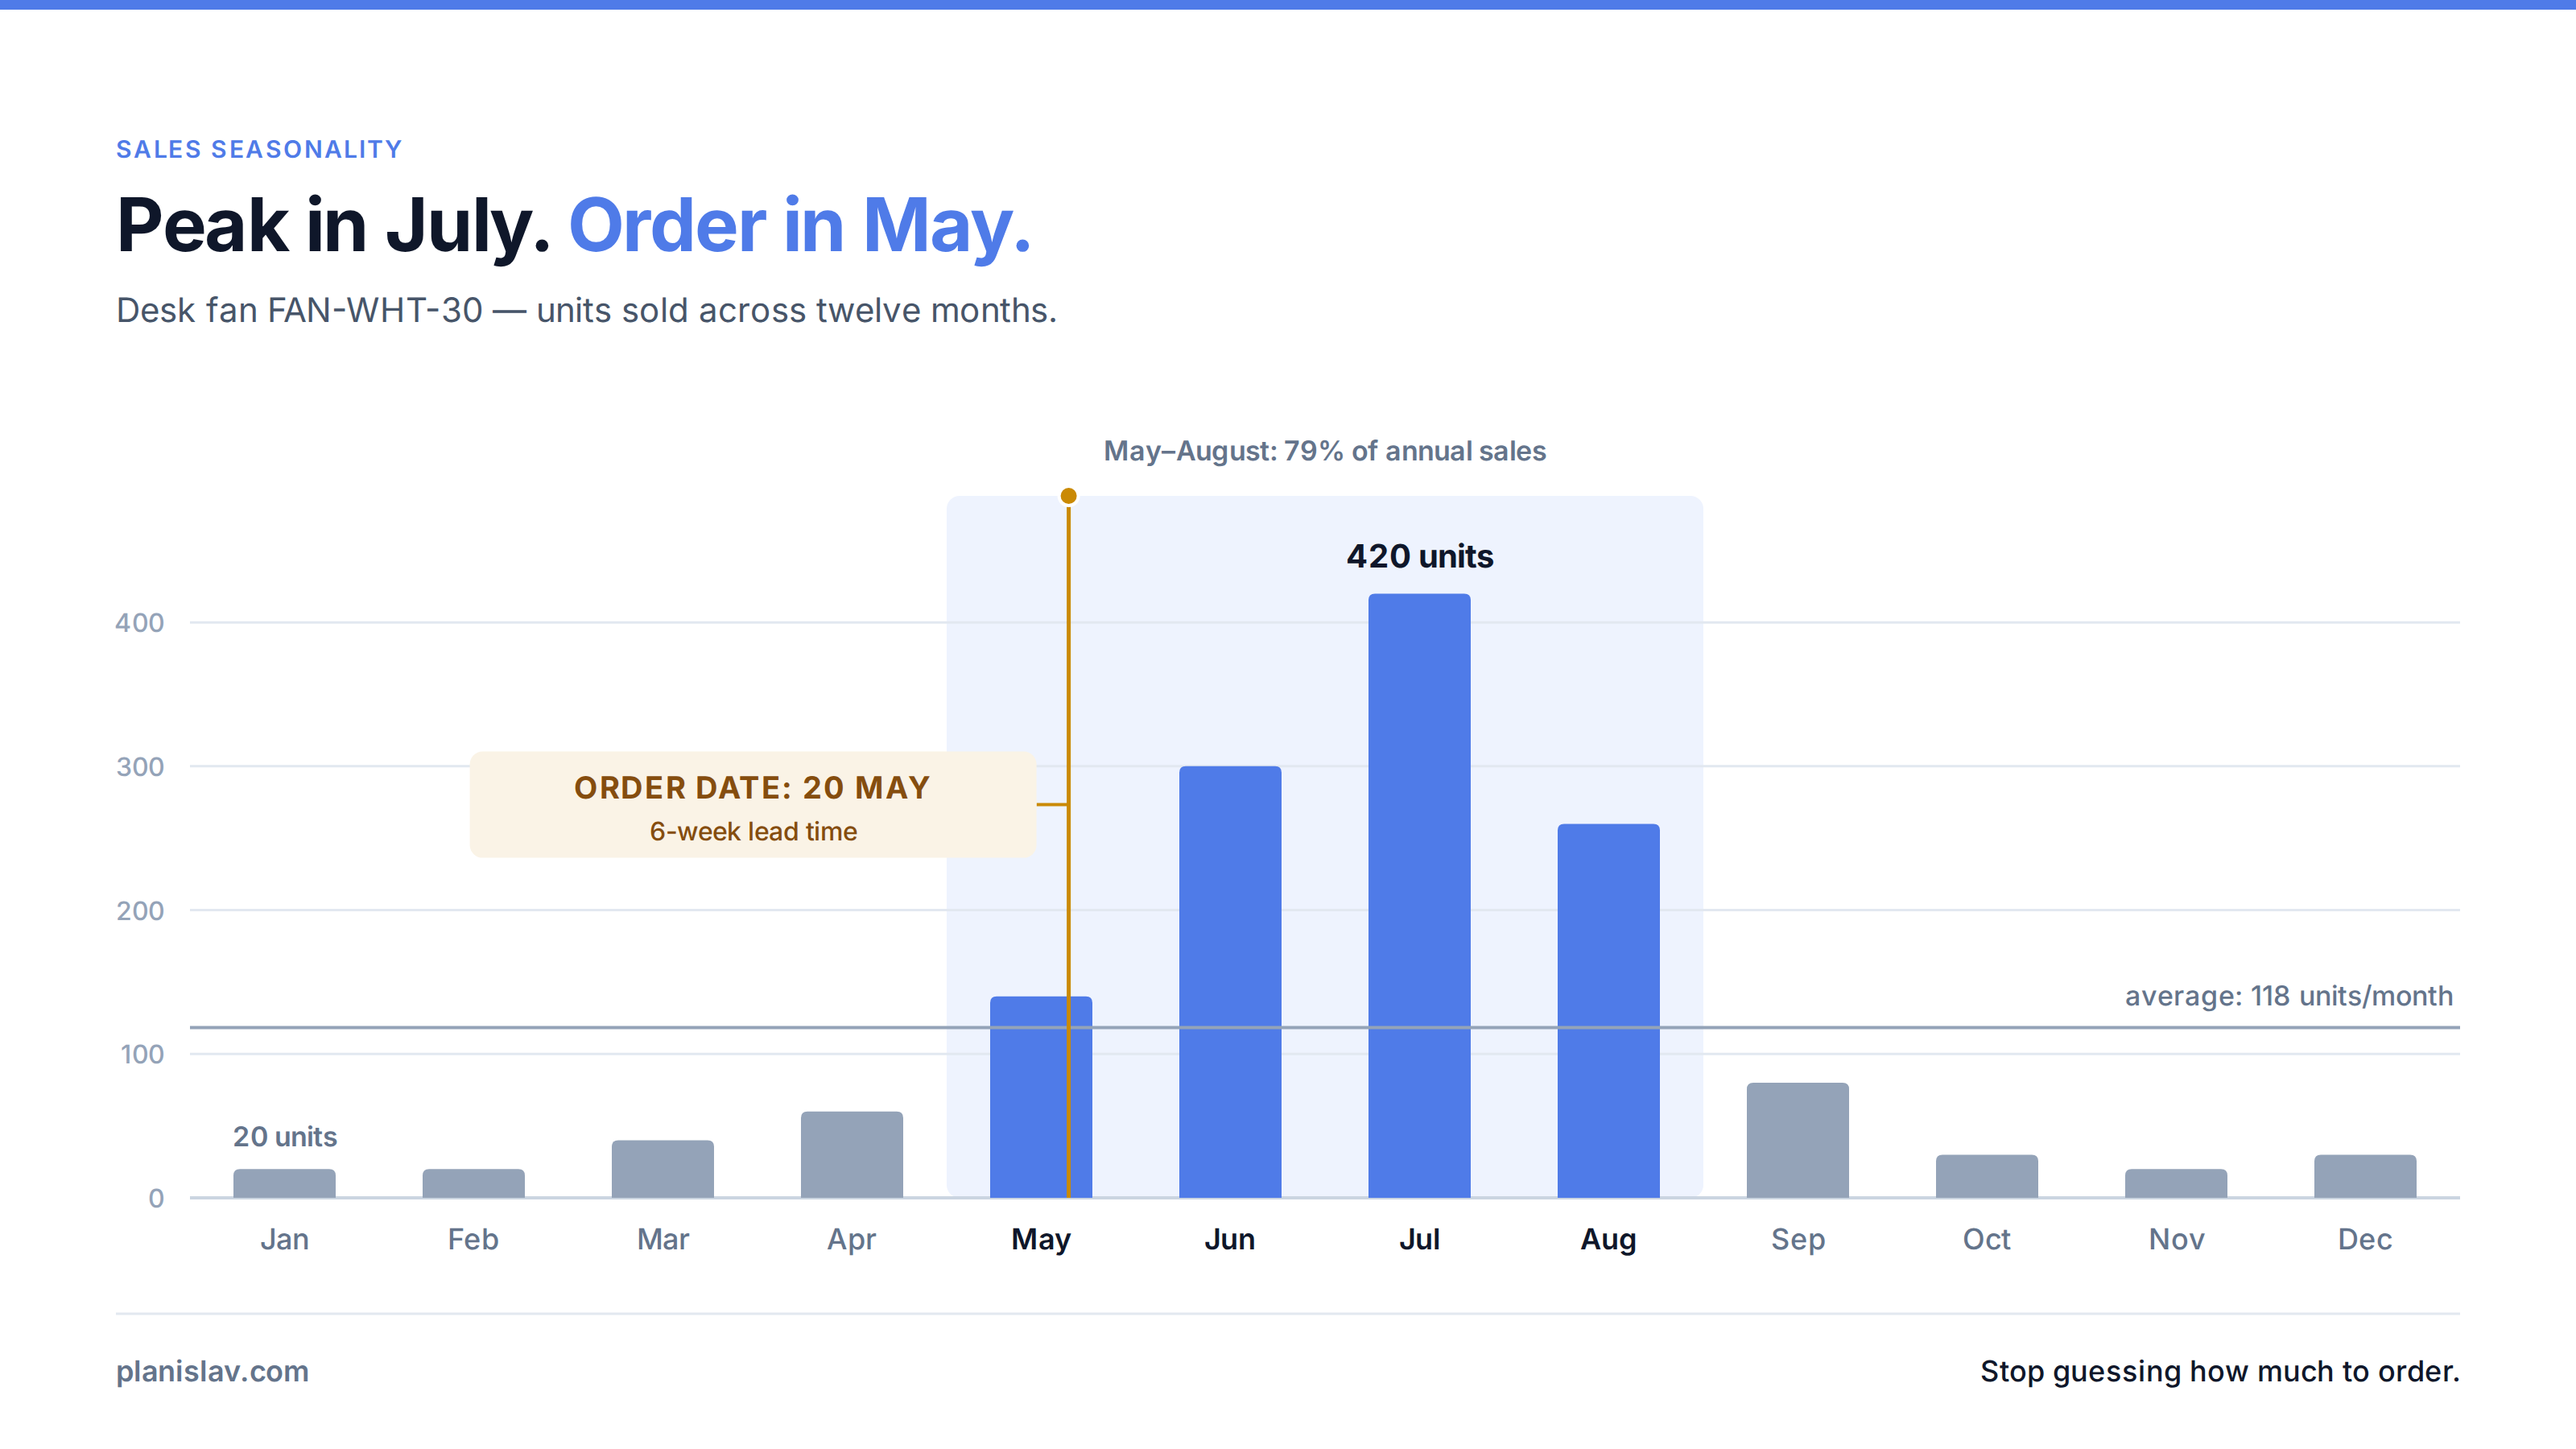
That is 1,420 units for the year, or 118 units in an average month. But the average does not describe a single real month. In July you sell 3.55× your average; in January, six times less. Between January and July there is a 21× swing.
The most important number here: May through August accounts for 1,120 units — 79% of the entire year in four months. The other eight months are 21% between them. Everything that matters for this product is decided inside one window, and the buying decision lands even earlier than that.
To do this with your own data:
- Export the last 12–24 months of sales, in units, at individual SKU level.
- Sum units for each calendar month.
- Calculate the average month (annual total ÷ 12).
- Divide each month by that average. That is your index.
- If you have two years of history, average the indices across both years — a pattern that repeated twice is far more trustworthy than a single year.
Above 1.3 is a peak month. Below 0.7 is the dead season. Everything in between is business as usual.
Why seasonality wrecks your stock levels
Here is the crux. The most popular ordering method in small stores is “look at what sold last month and order roughly the same again”. On a seasonal product that method does not merely fail — it fails in exactly the wrong direction.
Back to the fan. It is late April. You sold 60 units. The 30-day average says: order 60 for May. Real May demand turns out to be 140. You missed 80 units — 57% of that month's demand.
And it gets worse. A moving average always looks backwards, so it only catches up with the season once the season is over. In August it will recommend a big order based on a strong July — right as demand starts falling off a cliff. It is a mechanism that systematically under-buys going into the peak and over-buys coming out of it. We unpack this separately in the 30-day average is not a forecast.
Getting it wrong costs you either way, just differently:
- Too little stock. At a $39 price and a 32% margin, every 90 units you could not sell is roughly $1,120 in lost margin — before counting the customers who went to a competitor and never came back. The full calculation is in our piece on the cost of a stockout.
- Too much stock. 120 surplus units at around $26 landed cost is over $3,100 of cash frozen on a shelf for eleven months. If the product has a seasonal design or a shelf life, you will only get part of that back, and only at a discount.
Note the asymmetry: excess usually hurts more in cash, shortage hurts more in margin and in customer relationships. On strongly seasonal products it is worth deciding deliberately which side you would rather be wrong on.
Lead time: why a July peak means a May order
This is the part that most often goes missing. Seasonality tells you how much. Lead time tells you when. Without the second number the first one is useless.
Say your supplier delivers in 6 weeks. You want the July stock on the shelf by 30 June at the latest. That means the order has to go out around 20 May.
And what is happening on 20 May? You are selling about 140 units a month — roughly your annual average. Everything looks calm. Instinct says “order normally”. Meanwhile you need to be committing to a month that will run three and a half times hotter, plus safety stock in case this season beats the last one.
The rule is simple: count back from the peak by one full lead time, and that is your order date. The longer the lead time, the earlier the decision, and the more you are leaning on a forecast rather than an observation. Importing from Asia on a 10–14 week lead time means deciding about July in April — when you are selling 60 units a month and nothing on the screen suggests a peak is coming.
Then add trend on top of the volume. If the store is growing 15% year over year, last year's July (420 units) becomes roughly 483 units this year. Seasonality sets the shape of the curve; trend lifts the whole curve.
Five pitfalls that break your seasonality numbers
1. Demand censoring. If you sold out on 18 July last year, your data shows 420 units — but real demand was higher. Sales history records what you sold, not what you could have sold. Planning on censored data under-orders a little more every year and locks the shortage in. If you know a product was unavailable, flag those periods and treat their sales as understated.
2. Micro-seasons. The calendar is not just summer and December. In most markets you also have Black Friday and Cyber Monday, Christmas, January clearance, Valentine's Day, Mother's Day, Easter, summer holidays, back to school, and Halloween. Several of these are 5–10 day windows that are invisible in monthly data yet can account for a serious chunk of the quarter.
3. Moving dates. Easter lands in March some years and April in others. Black Friday shifts between November and December weeks. Comparing “March to March” without correcting for this produces false conclusions about trend.
4. One-off events in the history. A big promotion, an influencer collaboration, a competitor's outage, a bulk order from a business customer. These spikes look identical to seasonal ones in the data, but they are not coming back. If you do not flag them, next year you — or your model — will buy against an event that will never repeat.
5. New SKUs with no history. A product launched in May has no January data, so its “seasonality” computed literally is meaningless. Borrow the pattern from a comparable product in the same category instead of fitting a curve to three data points.
The minimum viable spreadsheet
With a dozen or so SKUs you can do this by hand in an hour:
- Column A — months. Columns B, C and onwards — units per SKU.
- Under each column, calculate the average month.
- Next to it, build a mirror table of indices: each cell divided by its column's average.
- Conditionally format anything above 1.3 in red and below 0.7 in grey. The pattern becomes visible instantly.
- Add a lead time in weeks for each SKU. Order date = start of the red window minus lead time.
That is enough for a dozen products. It stops working at two hundred, where every SKU has its own pattern, its own lead time and its own supplier minimum — and where the whole table has to be recalculated every month as new data arrives.
How Planislav detects seasonality and helps you order
Planislav takes over exactly the part that stops scaling in a spreadsheet.
Seasonality detected automatically. You do not have to tag the fan as a summer product and the advent calendar as a December one. The system recognises seasonal products from their own sales history and prepares a plan with the right lead time built in — no manual category tagging.
A forecast matched to the product. Every SKU gets a forecast from a model that fits its own sales pattern, not one blanket average across the catalogue. A fan with a July index of 3.55 and a screw that sells evenly all year need completely different treatment.
Bestsellers and long-tail products handled separately. Bestsellers get a plan with a safety margin, because the cost of a stockout on them is high. Niche products get lean orders, so they do not tie up cash.
The whole thing starts with one file: you upload your sales history as CSV or XLSX, optionally product data and current stock levels. From file to a finished order list takes about 30 seconds. The output is not a chart to interpret — it is a specific answer: what to order, how many units, and which day to place the order so the goods land before the peak.
FAQ — common questions about seasonality
What is sales seasonality? A repeating pattern of rises and falls in demand that returns at the same time each year. Unlike random variation it is predictable, which means you can plan purchases around it.
How do I calculate a seasonal index? Divide sales in a given month by the average month across the year. A result of 2.0 means twice the average; 0.5 means half. With two years of history, average the indices from both years.
How much sales history do I need to detect seasonality? Twelve full months is the minimum to see a yearly cycle at all. Two years lets you separate a real pattern from a one-off event; three gives a genuinely stable picture.
Does seasonality only affect obviously seasonal products? No. Even year-round products fluctuate with paydays, sales events, back to school and the Christmas period. The swings are smaller, but at volume they still move your stock requirement.
When should I place a seasonal order? Count back from the start of the peak by one full lead time and add a buffer for delays. With a 6-week lead time and a July peak, the order has to go out around 20 May — while sales still look completely calm.
Is a 30-day average good enough for a seasonal product? No. A moving average always looks backwards, so it under-orders going into a season and over-orders coming out of it. On a product with a peak index of 3.5 that gap runs into hundreds of units.
What do I do if I ran out of stock last season? Flag the out-of-stock periods and do not treat their sales as full demand. Otherwise you will plan on suppressed data every year and make the shortage permanent.
Want to stop guessing how much to order before the season? See how Planislav turns your sales history into concrete purchasing decisions — planislav.com