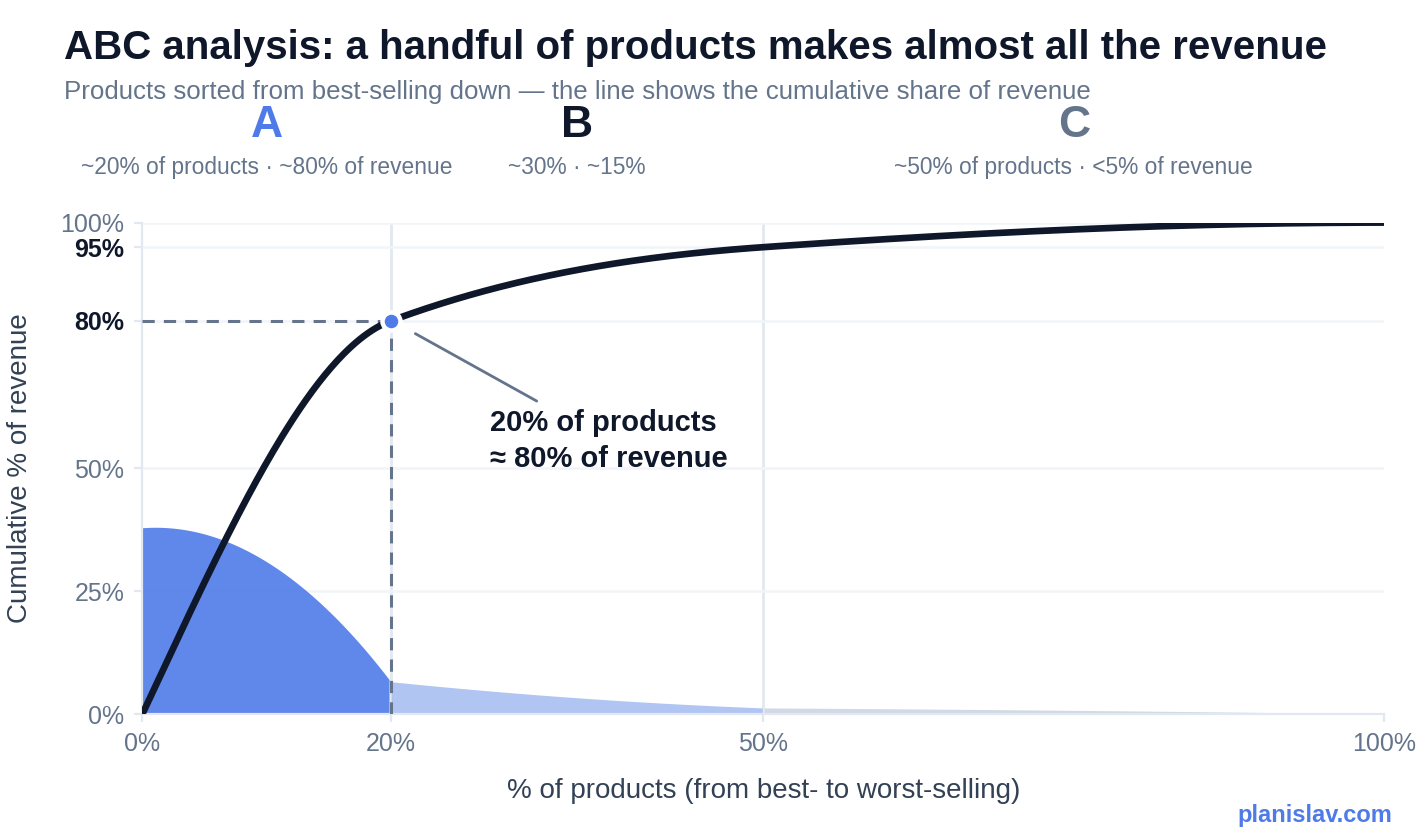
What is ABC analysis? It's a method of splitting your catalog into three classes by their share of sales: A — the small group of products that generates most of your revenue, B — the middle of the pack, C — the long tail that sells rarely but takes up most of the space in your catalog and warehouse. Sounds trivial? In practice, most stores treat every product the same — which is exactly why stockouts happen on bestsellers while cash freezes in products nobody buys.
ABC analysis in a nutshell: sort your products from the largest to the smallest share of revenue. The top of the list (typically ~20% of products, ~80% of revenue) is class A. The middle is B. The rest — half your catalog, a few percent of revenue — is C. Each class deserves different attention and different purchasing decisions.
Where does ABC analysis come from?
This is not a LinkedIn fad. The method was described in 1951 by H. Ford Dickie, a General Electric engineer, in an article with a telling title: "ABC Inventory Analysis Shoots for Dollars, Not Pennies." Dickie built on Vilfredo Pareto's observation that a small share of causes accounts for most of the effects. In a warehouse, that means a small group of products makes your numbers — and everything else mostly makes clutter.
The classic textbook breakdown looks like this: class A is roughly 20% of products generating ~80% of revenue, class B is ~30% of products and ~15% of revenue, and class C is half of the catalog delivering less than 5% of revenue. That's an illustrative convention, not a law of nature — your store's proportions will differ — but you will almost certainly see the same shape of the curve.
Why should you know which products are A, B and C?
Because your time and your cash are limited. ABC analysis answers one question: where should you focus?
A products — this is where stockouts hurt most. One day without a bestseller in season is real lost revenue, and often a customer who bought from a competitor and won't come back. A products deserve more frequent orders, close attention to delivery dates, and stock checks before things heat up.
B products — the solid middle. They don't need daily attention, but it's worth watching whether any of them is climbing into A (a rising hit) or sliding into C (a fading product).
C products — half the catalog, a few percent of revenue. This is where cash freezes: "I'll order a bit of everything, just in case" means a box that sits for a year. C products should be ordered less often, in smaller quantities — and some of them are best sold off and discontinued.
Without this split, every purchasing decision weighs the same — so you inevitably give a bestseller the same attention as a product that sold three times in six months. That's the most expensive kind of fairness in e-commerce.
How to run an ABC analysis in Excel — step by step
- Step 1. Export sales per product (SKU) for the last 12 months. A full year neutralizes seasonality; 3 months is the minimum, but the result will be less stable.
- Step 2. Calculate revenue per product (units × selling price). If your margins vary a lot, use margin instead of revenue — the result will be closer to the truth about what actually earns money.
- Step 3. Sort descending and compute the cumulative share of revenue.
- Step 4. Set the classes: products up to ~80% of cumulative revenue — A, up to ~95% — B, the rest — C. The thresholds are conventions — 80/95 is a popular starting point, not a law of physics.
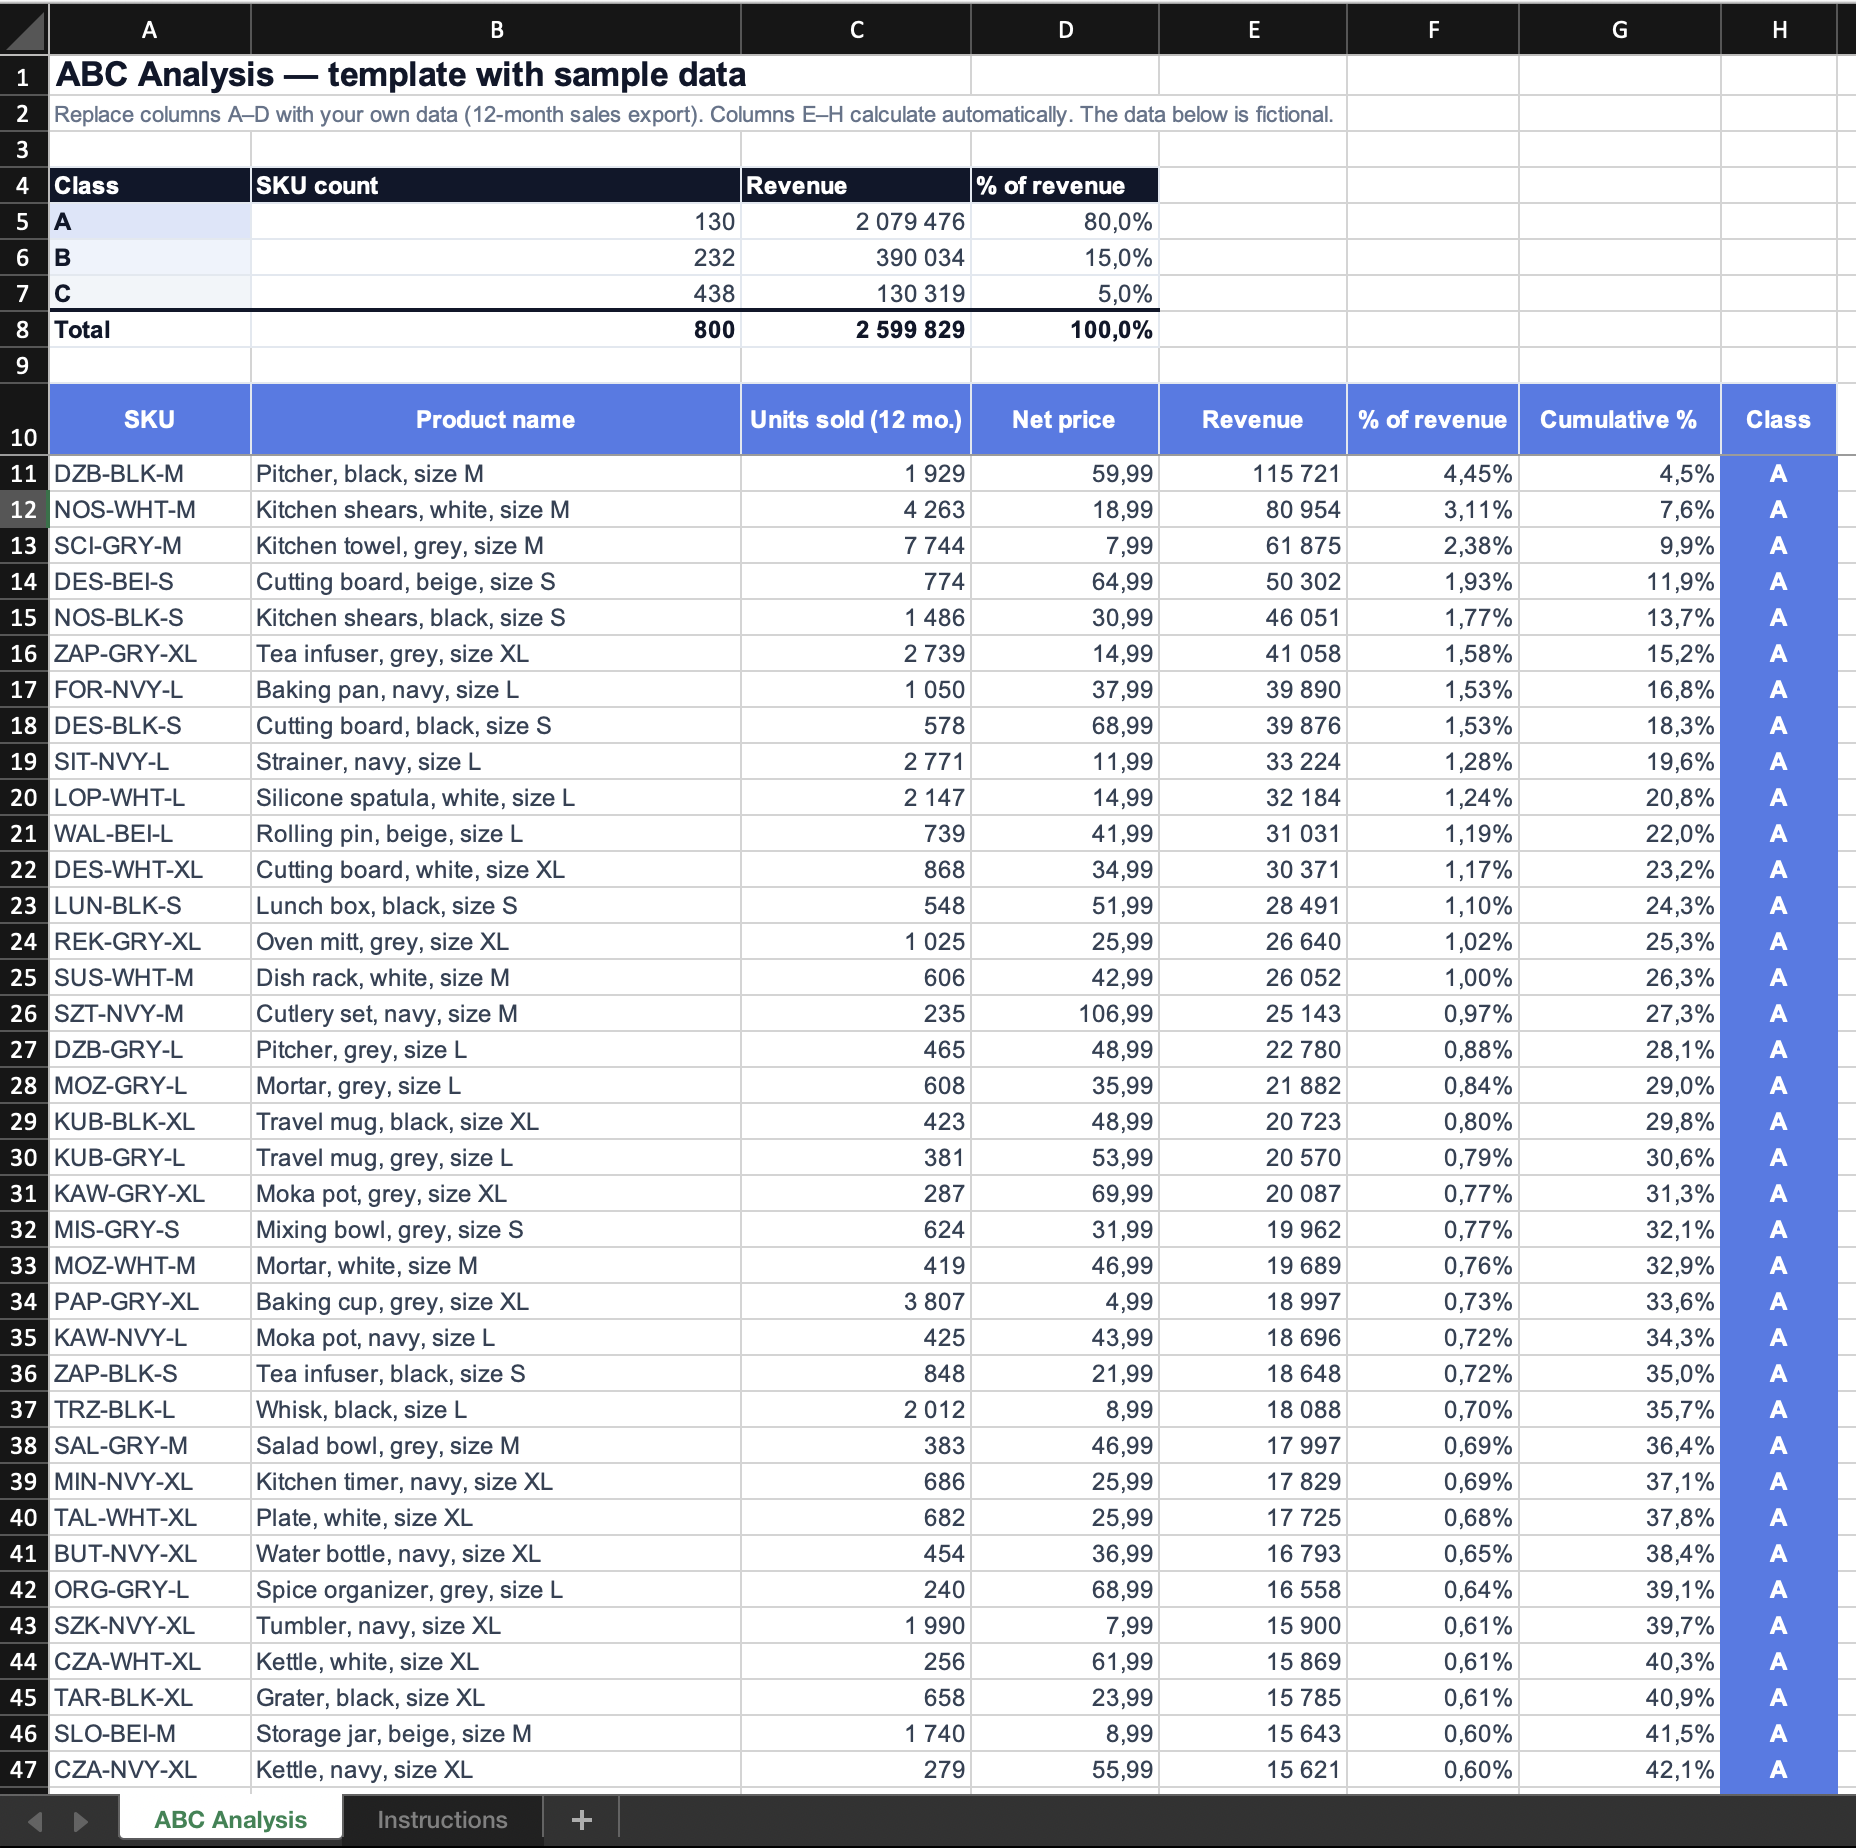
Don't want to build the spreadsheet from scratch? Download the ready-made ABC analysis template (.xlsx) — with sample data and formulas that assign the classes automatically. Swap in your own sales and you're done.
Example: a kitchen accessories store with 800 SKUs. After sorting, it turns out 130 products make 80% of revenue (A), the next 232 add 15% (B), and the remaining 438 together contribute 5% (C). The owner used to spend most of his time "reviewing everything." Now he knows the list he needs to know by heart has 130 items, not 800.
The pitfalls of ABC analysis — what most guides won't tell you
ABC analysis is simple, and that's its strength. But it has limitations you need to know before you start basing decisions on it. We spell them out, because most guides end at step 4.
Classes keep changing. Lokad, a French company that studies inventory management methods, points out that with typical settings between a quarter and a half of all products change class every quarter. An ABC analysis done once a year in Excel is a photo of the past, not a map of the future.
ABC is blind to seasonality and new products. Lokad's classic example: a toy launched in spring is a C-class item in October — because that's what history says — right before Christmas turns it into an A. The same problem applies to every seasonal product and every new item that hasn't built up a sales history yet.
History is not the future. Nicolas Vandeput, a demand planning practitioner and author of well-known books on supply chain forecasting, warns against mechanically setting priorities and service levels straight from ABC classes: high sales in the past don't guarantee a product matters tomorrow, and low sales don't guarantee it won't.
Frequency is not importance. A C product can be strategic: a spare part without which the customer won't buy your A product, or an item that drives traffic to your store. Revenue share alone won't show that.
The conclusion is not "don't do ABC analysis." The conclusion is: do it regularly, read it together with seasonality and trend, and treat it as a map of attention — not a decision-making machine.
What does planislav do about it?
This is exactly why planislav classifies your products automatically — and keeps the classification up to date, instead of once a year. ABC analysis is built in: the system derives the classes from your sales history and updates them as products move up or down. On top of that, it adds what pure ABC analysis can't see: the seasonality and demand stability of each product.
The outcome is practical, not academic. You don't get a table of letters to interpret on your own — you get a purchasing list: what to order, how much and by when, accounting for the fact that an in-season bestseller needs different treatment than a long-tail product. You don't set thresholds or parameters. And if you want to know why the system suggests this particular quantity — you can ask and get a one-sentence answer.
FAQ — common questions about ABC analysis
How is ABC analysis different from the Pareto principle? The Pareto principle (80/20) is a general observation that a minority of causes produces the majority of effects. ABC analysis is its practical application to inventory: splitting products into classes by their share of sales.
Should I rank by revenue, margin, or units sold? Most often by revenue, because it's simplest. If margins across your catalog vary a lot, rank by margin — you'll learn what actually earns money, not just what generates turnover.
How often should I refresh the ABC analysis? At least quarterly — classes can reshuffle significantly. Best of all is when it refreshes itself, continuously.
How many products should be in class A? There's no fixed rule. Typically class A is somewhere between 15–25% of products accounting for ~80% of revenue. More important than the exact threshold: the A list should be short enough that you can realistically keep it under control.
Is ABC analysis enough to plan purchasing? No. ABC tells you which products matter, but not how much and when to order. For that you also need seasonality, sales velocity and supplier lead times.
What is ABC/XYZ analysis? An extension that classifies not only the share of sales (ABC) but also demand stability (XYZ): X — stable demand, Z — unpredictable. It helps decide where more safety stock is needed — though it inherits the same limitations as plain ABC.
Sources
- H. Ford Dickie, ABC Inventory Analysis Shoots for Dollars, Not Pennies, "Factory Management and Maintenance", July 1951, vol. 109, pp. 92–94 — the original description of the method
- Lokad — ABC analysis (Inventory) — definition, example and limitations
- Lokad — ABC XYZ analysis — the demand-stability extension and its critique
- Nicolas Vandeput — ABC Analysis is Not a Good Idea. Do This Instead. — why sales history is not the future
Want to stop guessing what to order? planislav classifies your products automatically and turns your sales history into a concrete purchasing list — planislav.com