Every system you can run a warehouse in has a "minimum stock" field. You type in a number, and when stock drops below it, the system highlights the product or adds it to an order. Where that number came from is a separate question, and we'll get to it in a moment. At 50 products the threshold is enough, because the real planner is you and the threshold only reminds. At 2,000 products the threshold is on its own. This article is about what your system actually calculates at that point, why one threshold for every SKU fails in a predictable way, and what it costs.
Where the minimum stock (reorder point) comes from
By the textbook, minimum stock is the reorder point (ROP): the stock level at which you have to place an order so that the goods arrive before you run out. The formula has two parts, demand during the lead time and safety stock:
ROP = average daily sales × lead time in days + safety stock
Example: you sell 10 units a day on average, the supplier delivers in 21 days, safety stock is 30 units. ROP = 10 × 21 + 30 = 240. When stock drops to 240, you order. How to calculate the second component is covered in a separate article on safety stock.
The formula is correct. The problem sits in the assumptions nobody usually reads: average daily sales are constant over time, the fluctuations around them are symmetric, the lead time doesn't change, and each product is decided on its own, independently of the rest. That's how textbooks present it (an example lecture from the University of Iowa) and that's how Lokad describes it too, having added a note at the top of its own tutorial that the textbook approach is "vastly dysfunctional". Not one of those assumptions holds in a shop with a season, a long tail of products and a supplier who delivers in 14 days one time and 60 the next.
Before we go on: where did your threshold come from?
The formula above assumes somebody used it. Before you get to the system comparison, four questions worth answering honestly:
- How did you set the minimum stock? Did you calculate it from lead time and sales, or did you type in "10, it's a round number", "one case", "same as the similar product", "enough so we don't run out"?
- Did you look at this product's sales history while doing it, or at the last two weeks and a gut feeling?
- When did someone last change that threshold? Do you know who, and why?
- How many products have exactly the same threshold today, because you set it in bulk?
We don't know of a study that measured how shops set their thresholds (if you do, write to us). We do know how the tools are designed. InsERT's documentation describes minimum stock as a field that "is used for filtering lists", not as the result of a calculation, and the bulk operation writes one number into every selected record. In Base.com you type the threshold into an empty field, with no hint. WAPRO published a guide to its order generator explaining that they wrote it because "few people use the order generator (few questions or doubts reported)", which means that even where the tool can calculate something, hardly anyone uses it. None of the systems in the comparison below will ask where the number came from, and none will tell you when it stopped fitting.
The rest of this article assumes the best case: a threshold calculated from the formula, from sales history, with a current lead time. If yours looks different, every problem described below starts earlier.
What your system really calculates when it says "order"
We went through the documentation of the systems most Polish e-commerce runs on (as of September 2026). Outside Poland the names will differ; the mechanics are worth checking in your own system, and the four questions above apply everywhere. We were interested in three things: who enters the threshold, where the proposed quantity comes from, and whether lead time enters the calculation at all.
Base.com (formerly BaseLinker). The only purchasing parameter on the product card is the stock threshold („Stan – próg" in the Polish panel), set separately per warehouse. You enter it by hand, and in bulk only through a CSV import, because from the panel "there is no such option". The "Purchasing orders predictions" feature calculates the order quantity as average sales over the last 7, 14, 30, 60 or 90 days multiplied by the number of days of stock you specify; optionally it adds the threshold and subtracts current stock. Those settings apply to the whole run, not to an individual product. Lead time, seasonality, the supplier's minimum order and case pack don't appear in the form. For a few dozen products with stable sales it is a sufficient feature, and that is exactly the role it plays.
Polish ERP and warehouse systems. More options here, but the mechanics turn out to be surprisingly similar. For each system: what the threshold is, where the order quantity comes from, and whether lead time enters the calculation.
- Subiekt GT — threshold: minimum stock, entered by hand (in bulk: one number for all selected). Quantity: no built-in generator; supplier orders are created by hand or through partner add-ons. Lead time in the calculation: no.
- Subiekt nexo PRO — threshold: minimum and optimal quantity, per warehouse. Quantity: optimal quantity minus available stock (plus customer orders). Lead time in the calculation: no (the field exists, it doesn't enter the calculation).
- Comarch ERP Optima — threshold: minimum, maximum, "order in multiples of". Quantity: fill up to min/max, or the shortage report: sales for a period (default: previous month) minus stock minus open orders. Lead time in the calculation: no.
- WAPRO Mag — threshold: min/max stock. Quantity: the generator takes the largest of several sections (fill to max, issues over a period × days of cover, linear regression). Lead time in the calculation: only to pick the supplier.
- Symfonia Handel — threshold: min/max stock, per warehouse. Quantity: customer orders plus the gap to minimum stock. Lead time in the calculation: no (in the ERP edition: a separate module).
- enova365 — threshold: min/max stock, per warehouse. Quantity: by turnover over a period, or fill up to min/max. Lead time in the calculation: not confirmed.
- Streamsoft Prestiż — threshold: min/max stock, can be computed from average sales over N days. Quantity: customer orders plus min/max; the suggestion accounts for lead time and non-working days. Lead time in the calculation: yes.
A real forecast (one that tries to catch seasonality and trend) appears only in separately licensed modules: in Comarch ERP XL and in Symfonia ERP. The latter requires the user to set a "window size" for the analysis per product, and the documentation adds, to its credit: "There is no single window setting that is ideal for all cases". So the forecast is there, but someone has to tune it for every product separately.
The common denominator of all these systems: a human enters the threshold; the proposed quantity is a top-up to some level; if they look at sales history at all, it's as a flat average or a sum over a chosen window; lead time almost never enters the calculation. WAPRO's documentation put it most honestly in its guide to the order generator: "the generator cannot tell whether the absence of sales in the selected period results from a real lack of demand or only from the physical absence of goods in the warehouse". That sentence applies to every tool that calculates an average over the last N days.
Why one threshold for every SKU fails in a predictable way
With a small number of products none of the problems below hurts, because you see every product with your own eyes. Scale switches them on.
1. A threshold doesn't age loudly
You set the threshold once, usually when creating the product record, and even if it was calculated then, it was calculated on sales from a year or two ago. Then the product grows, declines or dies, and the threshold stays. Joannes Vermorel of Lokad puts it bluntly: the min/max method will trigger a reorder "no matter what", so a product that has been fading for a year gets reordered anyway, and inventory write-offs are built into the method by design. For it to work, the threshold would have to be revisited almost daily. At 2,000 SKUs nobody does that, and the systems don't help: in Base.com a bulk change of the threshold needs a CSV import, in Subiekt GT the bulk operation writes one number into every selected record. Go back to the four questions at the start: if the answer to "when did someone last change the threshold" is "I don't remember", that's not an exception, it's the default state of every system in the comparison.
2. Seasonality: the same threshold is too low before the peak and too high after it
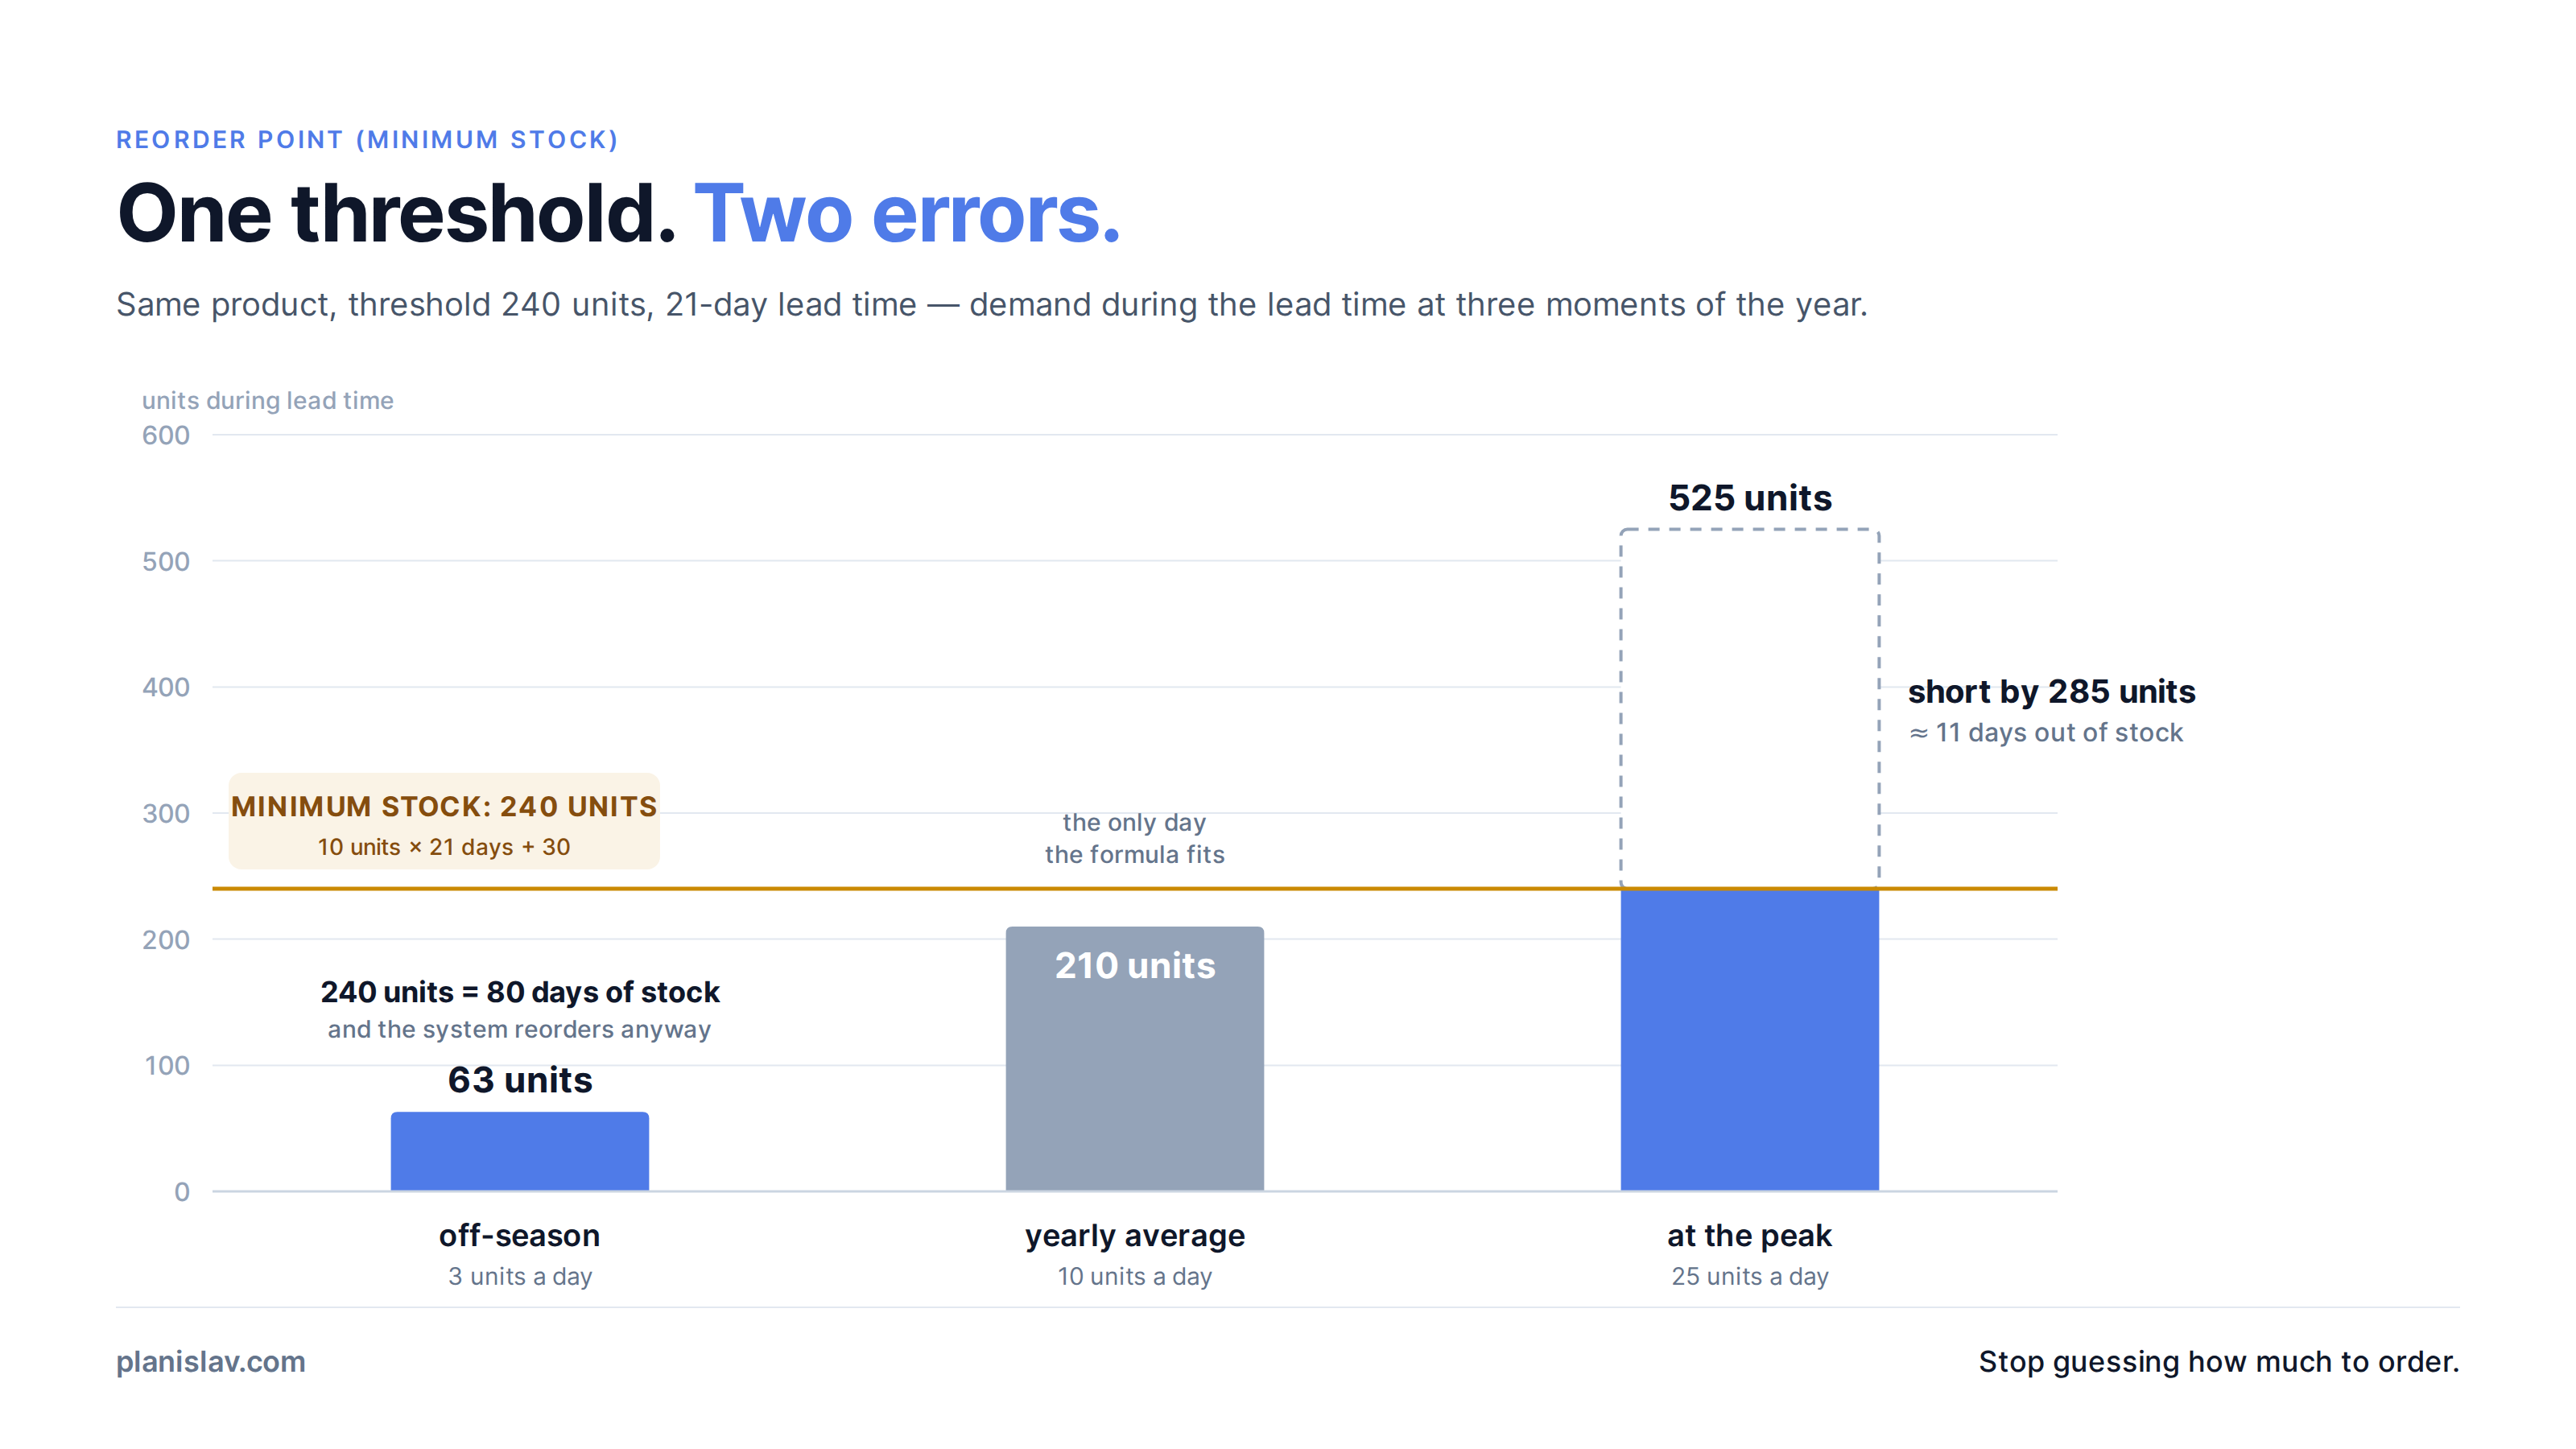
Back to the example: 10 units a day on average, 21 days of lead time, threshold 240. Except "on average" is an accounting fiction. Say that at the peak this product sells 25 units a day, and 3 off-season.
Before the peak, stock drops to 240 and the system orders. Over the 21 days of lead time you'll sell 25 × 21 = 525 units. You have 240. You're short 285 units, roughly 11 days without stock at the best moment of the year. Off-season, the same threshold of 240 is 80 days of sales, and the system reorders anyway, because stock dropped below the threshold. One product, one threshold, two different errors: a stockout at the peak, a surplus in the trough. For the threshold to be right, it would have to be about 555 units before the peak and about 93 off-season. None of the systems described above will change it on its own ahead of time; Streamsoft can recompute the threshold from an average of recent days, but such an average catches up with the season instead of getting ahead of it.
This isn't a matter of an under-engineered formula, it's a consequence of the constant-demand assumption. Tunc, Kilic, Tarim and Eksioglu calculated in a study in Omega (2011) what it costs to keep fixed inventory-policy parameters when demand is seasonal or trending: with a mild season, cost was higher by a dozen or so percent on average, with a pronounced one by more than 30%, and in the extreme cases of erratic demand the fixed policy turned out 2.3 times more expensive than one matched to the demand pattern. How to recognise a season in your own data is covered in the article on sales seasonality.
3. One distribution for very different products
The ROP formula assumes demand looks the same for every product, just with a different average. In practice your catalogue holds at least three different worlds: bestsellers that sell every day, seasonal products, and a long tail that sells two units in March, zero in April and five in May. For the last one, "average daily sales" describes a day that never happens. How many such products are there? In the Walmart store data from the M5 competition (30,000 product–store series) only about 7% of series had "smooth" demand; in two other retail chains analysed in the same paper it was 11% and 23%, and the rest was intermittent or erratic. Then there's value: the same "30 days of stock" means something different for a product that costs you 2 per unit and one that costs 400, more on which in the article on ABC analysis. Teunter, Babai and Syntetos showed on three large real-world datasets that even a fixed service level assigned to an ABC class produces solutions "far from cost optimal". One threshold for everyone is an even cruder simplification.
4. A threshold says "how much", not "when" or "which first"
The comparison above shows that lead time almost never enters the calculation. Yet it's what decides the moment to order: Lokad reminds us that lead time acts on stock linearly; twice the lead time means twice the stock. The second gap is less obvious. A threshold looks at each product on its own, and your cash is one pool. When 80 products cross their thresholds on the same day, the system generates 80 lines to order and won't tell you which of them to order if the budget covers 50. Lokad calls the alternative prioritized ordering: each successive unit of each product has a different expected return, and that is what the list is sorted by, not by who happened to drop below a threshold.
What "a policy matched to the product" means (and why it doesn't mean 500 knobs)
The answer is not an ERP with 20 parameters on the product record, because then the problem from point 1 comes back at a larger scale: someone would have to maintain those 20 parameters for 2,000 products. A policy matched to the product means that five questions get settled for each product separately, but the system settles them based on data, not a person based on a hunch:
- How to forecast this particular product: by season, by trend, or as intermittent demand, where what counts is the probability of a sale, not the average. Why a 30-day average is not a forecast is covered separately.
- How much buffer to hold: more where a stockout costs a lot and demand is volatile; less where the product is cheap and predictable.
- When to order: a forecast over the lead-time period, not an average of the past, and not "when stock drops below".
- How much to order: accounting for the supplier's minimum, the case pack, and what's already in transit. That requires up-to-date master data.
- What first, when the money won't cover everything.
The difference from a threshold isn't that the formula is more complicated. It's that the input is a forecast for the coming weeks instead of an average of the past ones, and the parameters change with the data, not when someone happens to remember them.
What it's worth: numbers that can be defended
Here it's necessary to separate honestly what is known from research from what is an example.
Three things are known from research. The cost of holding inventory (capital, warehouse, insurance, the risk of obsolescence) is estimated in the literature at around 20–25% of inventory value per year; it's an old rule of thumb that Lokad traces back to Stock and Lambert's 1987 textbook. Every 100,000 of surplus goods therefore costs 20,000–25,000 a year, before anyone marks it down. Second: in the only independent, published case study we found for a company of similar scale, a Greek distributor with close to 10,000 SKUs (Nenes, Panagiotidou, Tagaras, European Journal of Operational Research, 2010), moving from the buyers' "empirical rules" to a policy calculated separately for each product lowered average stock by about 8% in the first year, with no deterioration in service level and with 3% sales growth. Third: in a meta-analysis of retail out-of-stock studies (Gruen, Corsten, Bharadwaj, 2002; 29 countries, 71,000 consumers) a typical retailer lost about 4% of sales to stockouts, and about half of the stockouts came from ordering and forecasting in the store, not from suppliers. That study covers brick-and-mortar stores from two decades ago, so treat it as an order of magnitude, not as your number.
Now an example, with the assumptions on the surface so you can substitute your own (the currency doesn't matter; the ratios do). A shop with 2,000 SKUs, stock at purchase cost of 1.2 million, revenue of 8 million a year, gross margin 30%.
- Cost of holding inventory: 1.2 million × 20–25% = 240,000–300,000 a year. You pay that today, whatever the tool.
- Stock lower by 8% (as in the case study): 96,000 in cash returns to the business once, and the holding cost falls by 19,000–24,000 a year.
- Lost sales of 4% of 8 million = 320,000, i.e. 96,000 of margin. If half the stockouts come from ordering and you manage to eliminate half of those, that's 24,000 of margin a year.
In total around 43,000–48,000 a year plus 96,000 of freed-up cash, with assumptions we deliberately keep low. If your shop has a pronounced season, the losses from point 2 (stockout at the peak, surplus in the trough) are higher than in this example, because the study by Tunc and co-authors shows the cost of a fixed policy rising with the amplitude of the season. If there's no season and products turn evenly, they'll be lower. You can put in your own numbers in the savings calculator. What makes up the cost of a stockout beyond lost margin is covered in the article on the cost of a stockout.
When minimum stock is enough
So that it isn't said the threshold is bad by definition. Minimum stock in Base.com or in Subiekt is a good tool if you meet most of these conditions: you have up to a few hundred products and know them by heart, sales have no pronounced season, the supplier delivers in days rather than weeks, you order from one or two suppliers, the threshold was calculated rather than typed in by feel, and once a week somebody actually reviews the list of products below threshold. In such a business the forecast is you, and the threshold reminds you not to forget. The problems in this article start when one of those conditions stops being true and the threshold stays, because nobody has time to change it.
How Planislav does it
In Planislav you don't set thresholds. You upload your sales history (as a file or through the Base.com integration), and for each product separately the system recognises the demand pattern: season, trend or intermittent sales, and on that basis calculates a forecast over the lead-time period, not an average of the past. Lead time, the supplier's minimum, case pack and goods in transit enter the calculation if you provide them. Safety stock is calculated in days of cover based on that product's forecast, so it rises before the season and falls after it, without changing anything by hand. The result is a purchase list, "order X units by date Y from supplier Z", that you can check: every line can be expanded to see what it follows from. Stop guessing how much to order. Check it on your own data.
Sources
- Base.com — Purchasing orders predictions, Product card (PL), Warehouse FAQ (PL) — documentation of the stock threshold field and order quantity calculation
- InsERT e-Pomoc (PL) — Subiekt GT: minimum stock, Subiekt GT: bulk change of minimum stock, Subiekt nexo: supplier order from minimum stock
- Comarch (PL) — ERP Optima: shortage report, ERP Optima: automatic order creation, ERP XL: demand forecast
- WAPRO (PL) — Order generator, An idea for managing stock levels in Wapro Mag
- Symfonia (PL) — Handel: the Requirements window, ERP Handel: Forecasting
- enova365 — e-commerce warehouse (PL), Streamsoft Prestiż — Purchase planning (PL)
- Lokad — The Min/Max Inventory Method Doesn't Work, Reorder point, Calculate safety stocks, The importance of lead time, Prioritized ordering, Inventory costs
- D. Bricker, Reorder Point — lecture slides, University of Iowa — the textbook formula and its assumptions
- H. Tunc, O. A. Kilic, S. A. Tarim, B. Eksioglu, The cost of using stationary inventory policies when demand is non-stationary, Omega 39(4), 2011
- G. Nenes, S. Panagiotidou, G. Tagaras, Inventory management of multiple items with irregular demand: A case study, European Journal of Operational Research 205(2), 2010 (full text)
- R. H. Teunter, M. Z. Babai, A. A. Syntetos, ABC Classification: Service Levels and Inventory Costs, Production and Operations Management 19(3), 2010
- T. W. Gruen, D. S. Corsten, S. Bharadwaj, Retail Out-of-Stocks: A Worldwide Examination of Extent, Causes and Consumer Responses, GMA/FMI/CIES, 2002
- E. Theodorou, E. Spiliotis, V. Assimakopoulos, Exploring the representativeness of the M5 competition data, 2021 — the share of intermittent demand in retail data